Recap of Q3: Bad News Bears
US Stocks fell -3.3% in the third quarter and experienced their first negative quarter since Q3 of 2022. While equities surged in July, the market was hit with bad news throughout August and September, starting with the downgrade of the US Debt Rating by Fitch on August 1st. Moody’s quickly followed with downgrades of several small-to-midsized banks. Other negative news included a property crisis in China, surging Oil Prices and Treasury Yields, stickier inflation, a rising US Dollar and a “hawkish pause” by the Federal Reserve.
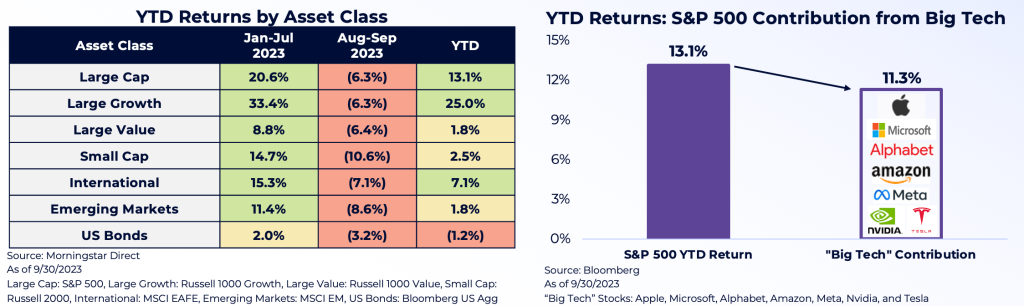
As shown below, all major asset classes experienced negative returns in August & September. International equities were hit harder than the US, in part due to a rising US Dollar and a slowdown in China. Most concerning to investors continues to be signals from the Bond Market and narrow breadth in the equity market. While the S&P 500 is up 13% in 2023, the majority of those returns (11.3%) have come from the “Magnificent 7” (Apple, Microsoft, Alphabet, Amazon, Meta, Nvidia, and Tesla).
Key Recession Indicators Starting to Turn Negative
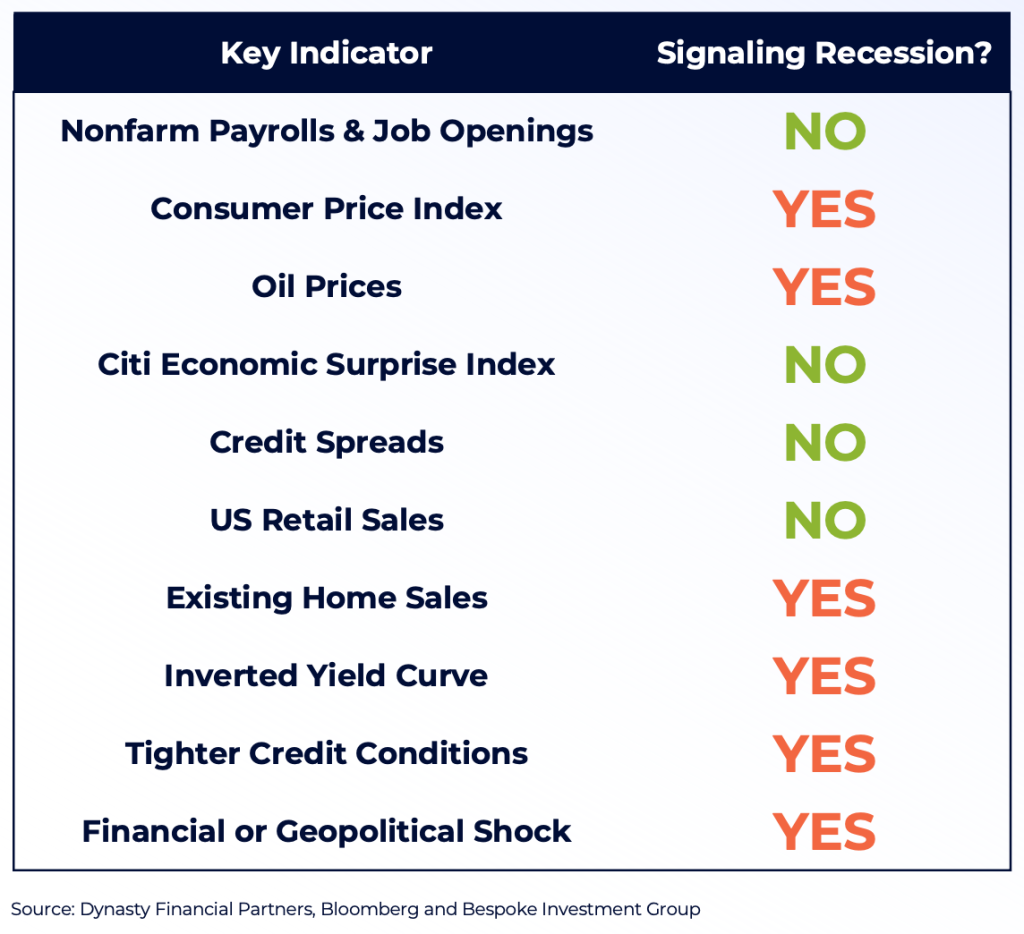 The market continues to send mixed messages regarding a possible Recession, with warning signs including:
- CPI rising last month and proving to be sticker
- Oil Prices hitting the highest level since November 2022
- Longest Yield Curve Inversion on record
- Highest 2- & 10-year Treasury Yields since 2006 & 2007, respectively
- Geopolitical Shocks including a Property Crisis in China
Despite these headwinds the overall economy has proven resilient, particularly with the labor market and strength of the consumer. The Unemployment rate remains below 4.0% and the number of Job Openings remains elevated. Consumers still have cash on their balance sheets and have been supported by locking in lower mortgage rates.
The Citi Economic Surprise Index, which shows if economic data is coming in above or below expectations, remains high – a positive sign for the economy. And while many bond indicators are flashing warnings signs, credit spreads remain low.
Possible Recession Timing
Monetary policy historically operates with a lagged effect on the economy. This makes it much tricker for Fed officials and investors to determine when or if a Recession may start. The Fed has raised interest rates to the highest level sine 2006 and we believe the lag from higher interest rates is starting to slow the economy. As mentioned previously, we are starting to see:
- Rising Bankruptcy Filings & Credit Card Delinquency Rates
- Slowing Bank Lending & Tighter Credit Conditions
- Falling Mortgage Applications to Purchase a Home
Every US Recession since the 1950s has been preceded by an inverted yield curve. The 10-year and 3-month yield curve is closely watched by investors and has been inverted for 222 consecutive trading days – its longest inversion on record. History shows a Recession begins much later after a yield curve initially inverts. In fact, the average number of days from the first date of inversion to the start of a Recession has been 589 days (dating back to the late-1960s). The current yield curve inversion reached its maximum inversion after the Regional Banking Crisis on May 3rd. Since then, the yield curve has steepened. Historically the number of days from peak yield curve inversion to the start of a Recession has averaged 395 days.
Fed’s “Hawkish Pause” Leads to Surge in Yields
While the Fed left rates unchanged at its last meeting on September 20th, Chair Powell delivered a strong message to the markets that additional rate hikes are on the table. Hawkish commentary at his press conference included:
- “The process of getting inflation sustainably down to 2% has a long way to go”
- “Majority of participants believe that it is more likely than not for us to raise rates one more time”
- “Full effects of our tightening have yet to be felt”
- “Labor demand still exceeds the supply of available workers”
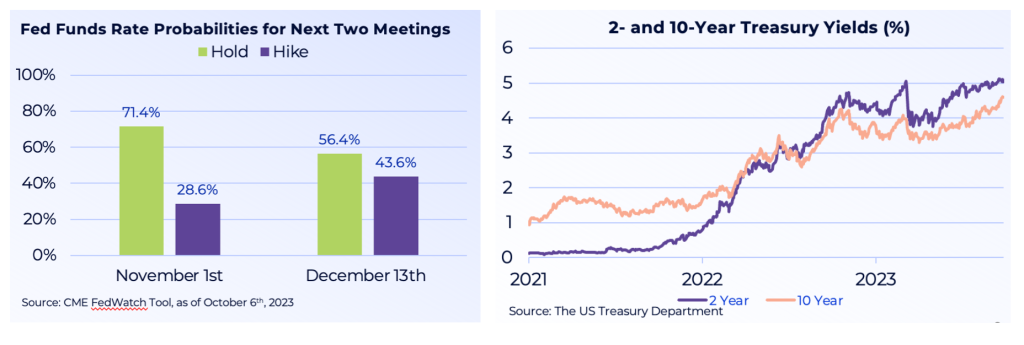
Yields surged in response to Powell’s comments and the Fed’s updated “Dot Plot” – which showed 12 of 19 voting participants expecting one additional rate hike in 2023. Many participants only expect 1-2 rate cuts in 2024 as well.
The market continues to believe the Fed will hold rates steady at its last two meetings of the year, according to the CME FedWatch Tool. As shown below, the market only sees a 28% chance of a hike at the November 1st meeting and a 43% chance of a hike at the December 13th meeting.
Yield Curve Madness – Why Are Long Yields Surging?
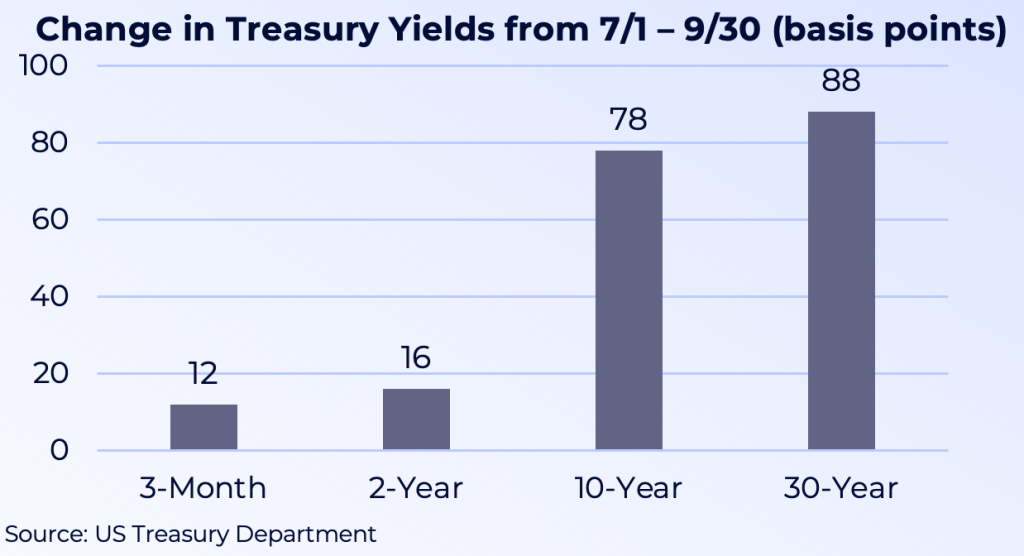 The steepening of the yield curve has been led by the surge in long-term Treasury yields. At the short-end of the curve, 3-month and 2-year yields are up 12 and 16 basis points since July 1st. But 10-year and 30-year Treasury yields have surged 78 and 88 basis points, respectively. Particularly concerning is how long-duration US Treasuries have not been rallying on good news. Instead, long-term Treasuries (as measured by the iShares 20+ Year Treasuries ETF) have experienced a drawdown exceeding 50% from their August 2020 highs.
Why are long-term yields surging? Below we highlight the major reasons:
- Downgrade of US Credit Rating, Increasing Deficits & Treasury Issuance: Fitch joined Standard & Poor’s on August 1st by downgrading the US Credit Rating to AA+. Ballooning debts and deficits are spooking investors and resulting in higher compensation in long-term yields. Rising deficits have already led to increased Treasury issuance. In 2024, Treasury Auction sizes are expected to increase on average 23% across the curve.
- Government Shutdown: A possible Government Shutdown is adding to worries that Washington can’t get its finances in order. The market was expecting a government shutdown on October 1st, but the House surprised markets with a 45-day continuing resolution to keep open the Government – which cost Speaker Kevin McCarthy his job.
- Fed Quantitative Tightening (QT): The Fed continues to be seller of US Treasuries, shedding nearly $1 trillion in bonds since June 2022. This leads to upward pressure on government yields.
- Japan Exiting Yield Curve Control (YCC): The Bank of Japan (BoJ) announced greater flexibility in its YCC to allow yields to rise as high as 1%. Japan is the world’s largest holder of Treasuries and higher yields could result in Japanese investors selling Treasuries.
- China Selling US Treasuries: China’s ownership of US Treasuries has dropped to roughly $800 billion, its lowest level since 2009. One reason for the selling has been to help China defend its weakening currency.
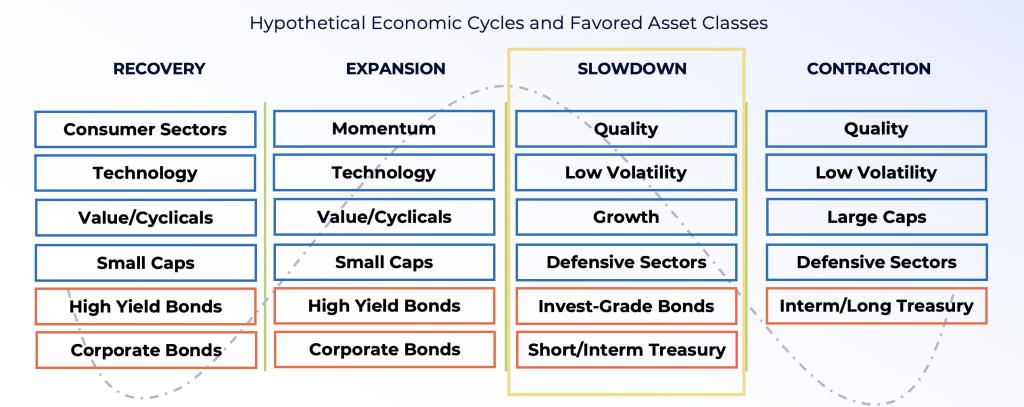
Investing in a Late-Cycle Environment
We believe the economy is approaching a Fed-induced slowdown. Ultimately the Fed will not stop hiking rates until the labor market cools, unemployment rises, and Fed members feel confident inflation is on its way back to its 2% mandate. As the economy slows down, we favor tilting equity portfolios towards High Quality and Low Volatility stocks, as well as Growth over Value. In terms of Fixed Income, we continue to favor high quality corporate bonds and short duration Treasuries. As the economy starts to slow, we believe investors can gradually extend portfolio duration.
What this means for the markets
 Hope for a Soft Landing, but Prepare for a Hard Landing. Our original forecast at the beginning of the year of “higher for longer” rates has panned out. We expect CPI to remain sticker between 3.0%-4.0% for the remainder of the year due to base effects. The Fed is determined to get inflation back down to its 2% goal, and will use hawkish rhetoric or even another rate hike in 2023 to accomplish its goal. Since the Fed’s “hawkish pause” at its September 20th meeting, yields have surged. We believe we are approaching a slowdown and recommend utilizing the playbook on the previous slide, such as high quality equities and short duration bonds.
Short-Term Treasuries Still Attractive and Consider Private Credit: Yields have run up significantly, with the 2-Year yield at the highest levels since 2006. The Fed controls the short-end of the curve and is nearing the end of its rate hiking cycle, which could result in lower yields. In addition, possible labor market softness and a slowing economy in Q4 could benefit Treasuries. We also believe investors should consider Private Credit. Banks have been under pressure to shore up their Balance Sheets and cut bank on lending. This has provided a huge opportunity for Private Credit to fill in the gap.
“There is an Alternative” – Underweight High Dividend Equities: Investors were accustomed to the acronym “TINA” (There is No Alternative) when interest rates were close to zero and equities seemed like the only attractive investment. But a surge in Treasury yields north of 5% are now challenging equities. As a result, higher dividend equities have come under significant pressure in 2023. The Utilities sector (measured by the Utilities Sector SPDR ETF) alone was down -9.2% in Q3 due to competition from the bond market. In fact, the spread in YTD performance between Utilities and the S&P 500 is over 30%, which is the second-biggest year of underperformance dating back to 1941. We recommend underweighting higher yielding equities. As shown on the right, the highest 100 dividend-yielding stocks in the S&P 500 are down on average -11.3%, while the 101 Non-Dividend payers in the S&P 500 are up 11.6%.
There are powerful price and seasonality trends that cannot be ignored. September lived up to its reputation as the weakest month of the year for equities on a seasonal basis, but October-December is historically the strongest 3-month stretch of the year. The fourth quarter has averaged a gain of 4.1% for the S&P 500 going back to 1945, which is double the next best performing quarter. Also worth noting is the 3rd year of a Presidential cycle has historically produced the strongest equity returns in a four-year cycle. While we expect volatility in October, we would not be surprised to see equities rally into year-end.
US over Developed Europe. Developed Europe is following the US in hiking rates, but we feel the US economy is proving more resilient and closer to the end of its rate hiking cycle. For example, Germany is the largest exporter to China in Developed Europe, but now faces the risk of an economic slowdown home and abroad. German 10-year yields also hit the highest levels since 2011.
Don’t Fight the AI Secular Wave, but Don’t Chase Either. Tech stocks have come under pressure in August & September along with the overall market. Despite the selloff, we would not be surprised to see Tech lead the market higher in Q4. We caution investors who are underweight Artificial Intelligence, as we believe this secular theme is still in the early innings. As mentioned earlier, the “Magnificent 7” has made up over 80% of the S&P 500’s YTD returns. Investors have also utilized Big Tech as a flight to safety over Utilities & Staples – a trend that may continue in Q4.