


 Source: Morningstar Direct, Bloomberg, Bespoke Investment Group and Dynasty Financial Partners As of 12/31/2023
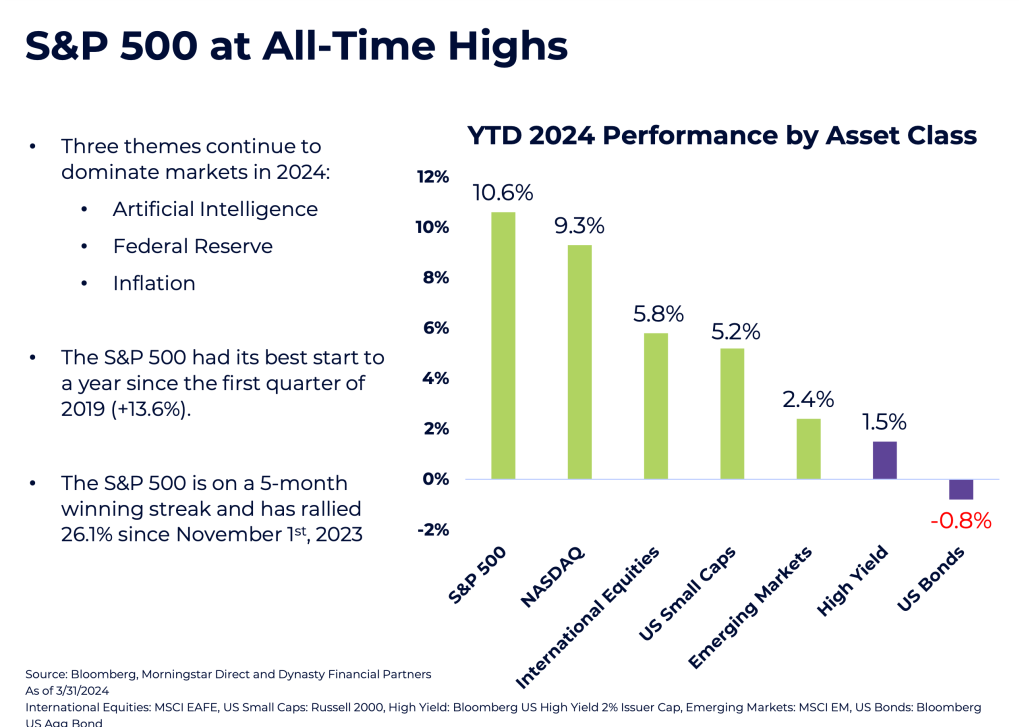
– Four themes dominated 2023:
– The S&P 500 ended the year on a nine-week winning streak, its longest since 2004.
– US Small Caps and Bonds were both negative YTD though October, but significantly rallied into year-end on the hopes of a 0% “soft landing” and rate cuts.
January – July: Markets rallied to start 2023, in part due to: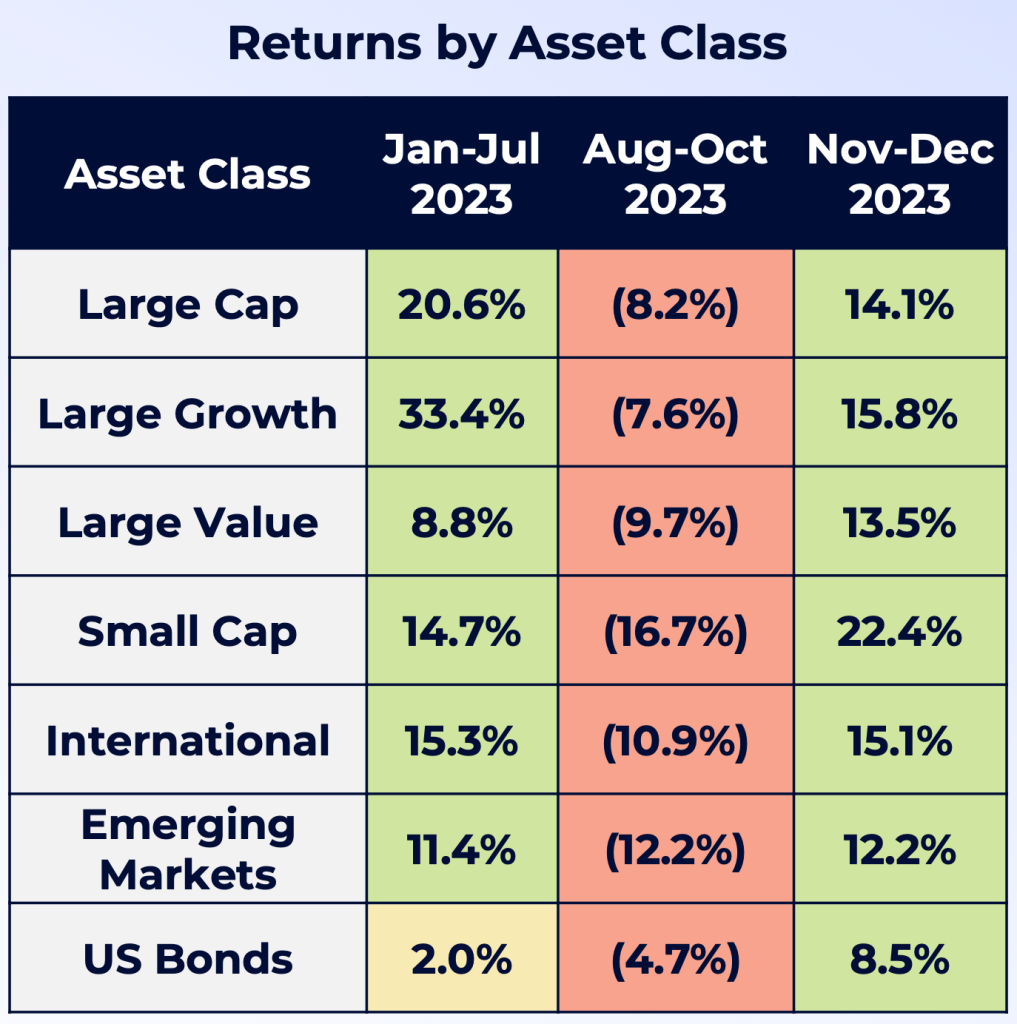
August – October: Bad news hit the markets, including:
November – December: Markets Rallied into Year-End due to:
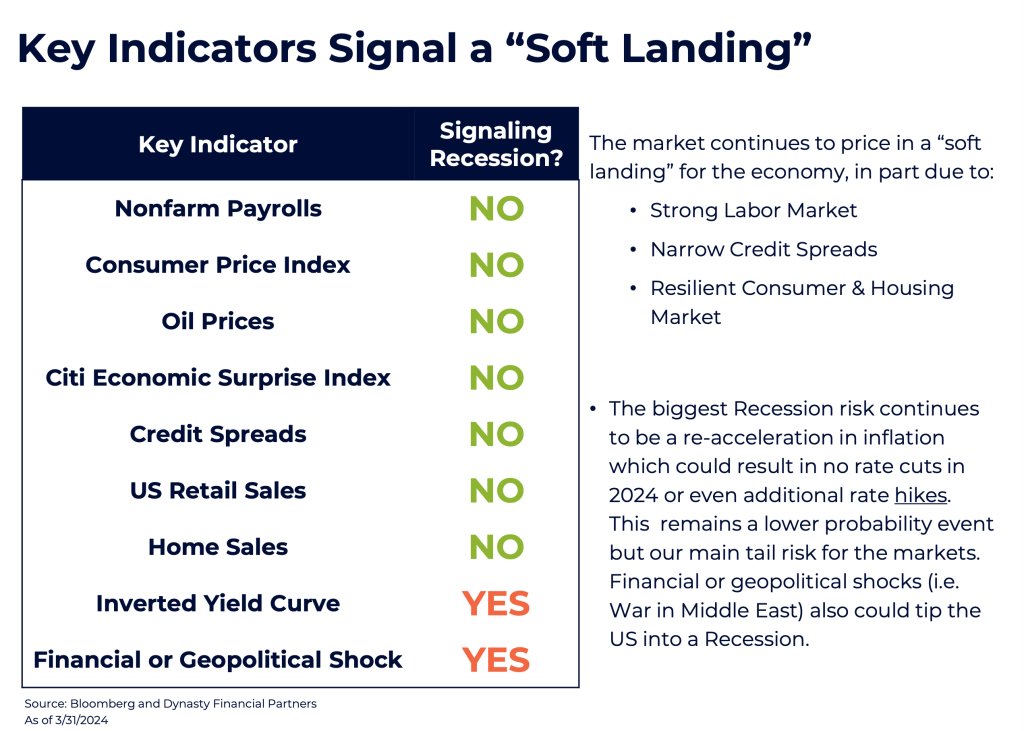
The market is pricing in a “soft landing” for the economy, in part due to: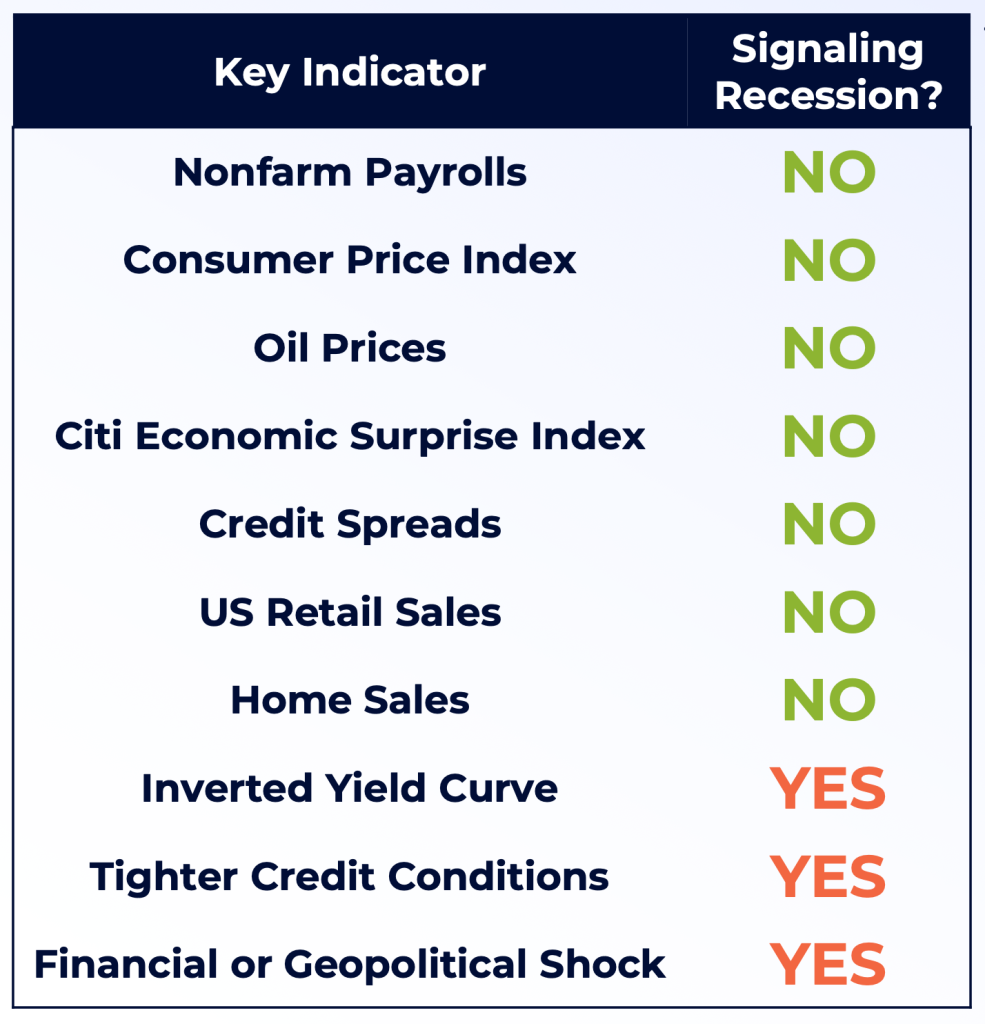
Every US Recession since the 1950s has been preceded by an inverted yield curve. The 10-year and 3-month yield curve is closely watched by investors and first inverted 419 days ago. History shows a Recession begins much later after a yield curve initially inverts. In fact, the average number of total days from the first date of inversion to the start of a Recession has been 589 days (dating back to the late-1960s). This leaves the current inversion period well below the historical average of when a Recession would begin.
An important reminder is the current yield curve has remained inverted for 284 consecutive trading days – its longest inversion on record.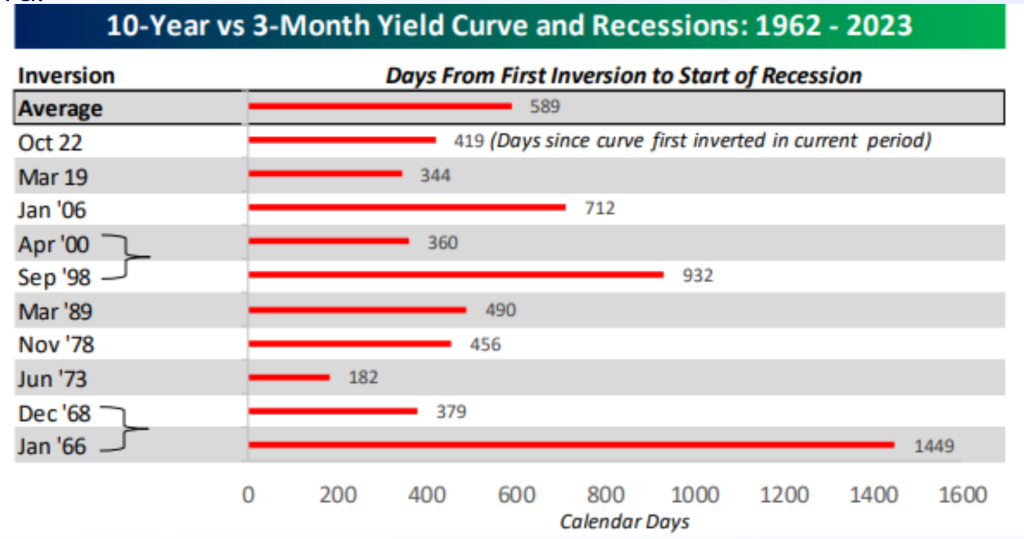
Monetary policy historically operates with a lagged effect on the economy. This makes it much trickier for Fed officials to determine when to stop raising rates, but it’s clear from the Fed’s most recent meeting that officials are now focusing on rate cuts in 2024. To highlight the “Powell pivot”, we compare key quotes below from Fed Chair Powell’s press conferences in November & December.
Notable Quotes from Fed Chair Powell’s Press Conference:
November 2023
December 2023
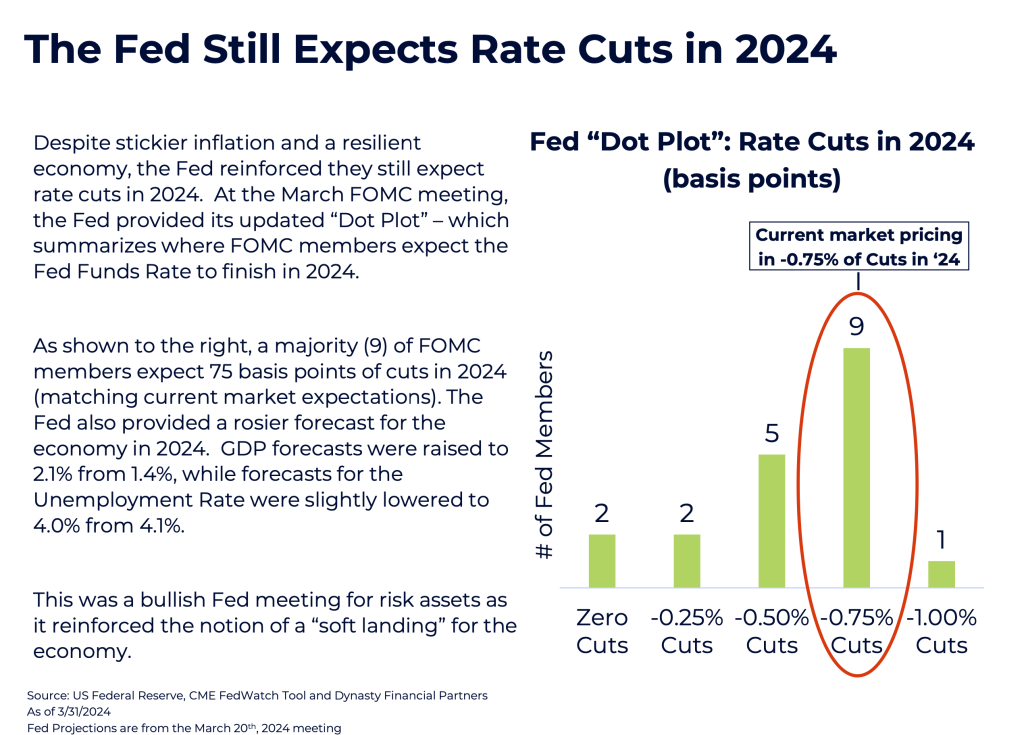
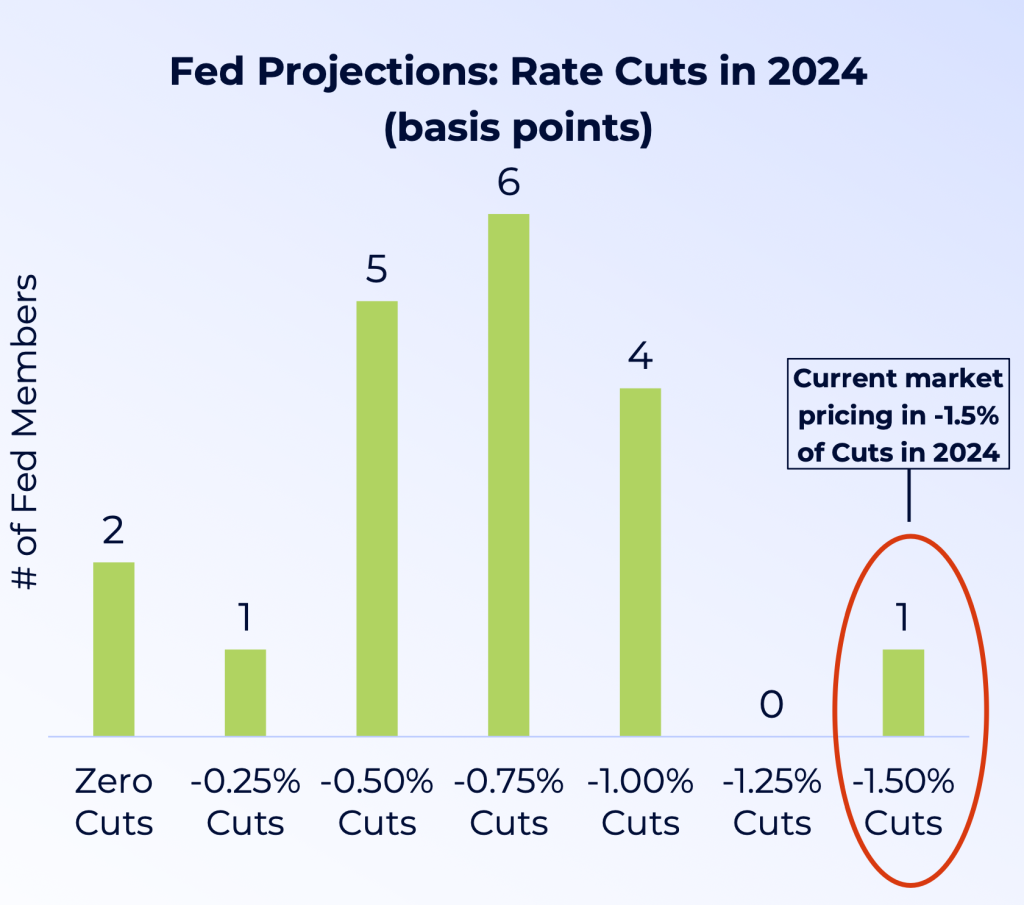 The “Powell Pivot” was also on full display when the Fed released their quarterly “Dot Plot” at the December meeting. The “Dot Plot” summarizes where FOMC members expect the Fed Funds Rate to finish in future years.
As shown to the right, a majority (6) of FOMC members expect 75 basis points of cuts in 2024. However, the market is currently pricing in 150 basis points of cuts in 2024. Once again, market expectations differ from the Fed.
The markets are also pricing in a 78% chance the first rate cut will occur at the March 20th meeting. Given the runup in equity prices and loosening financial conditions, we believe the Fed will do its best to hold off cutting rates until the second quarter.
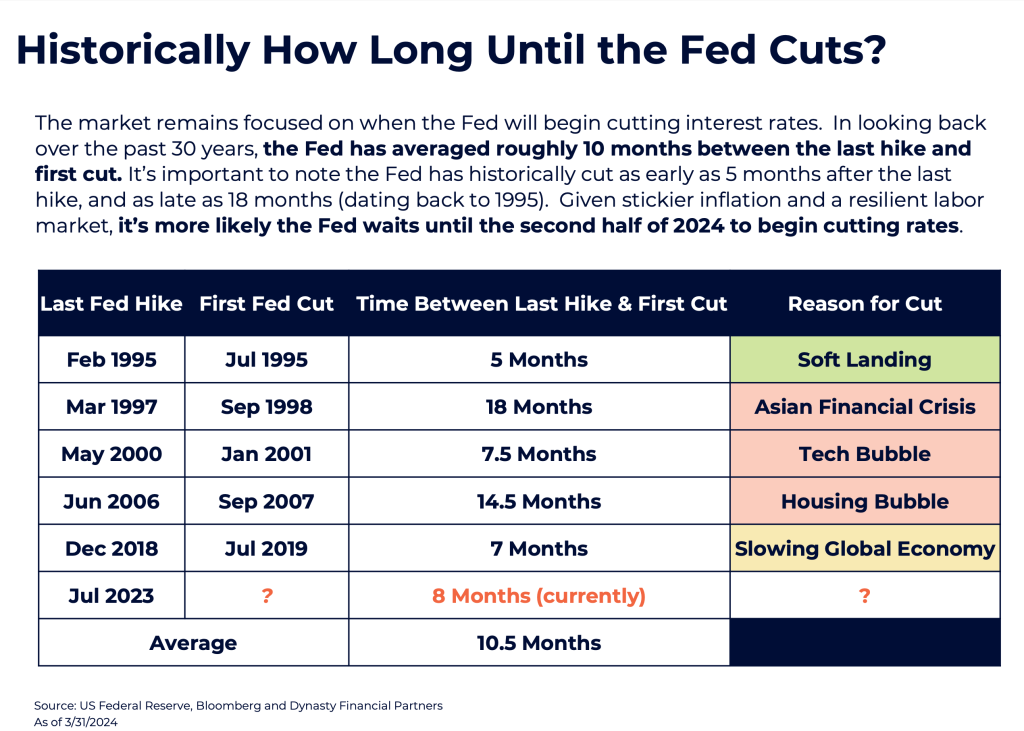
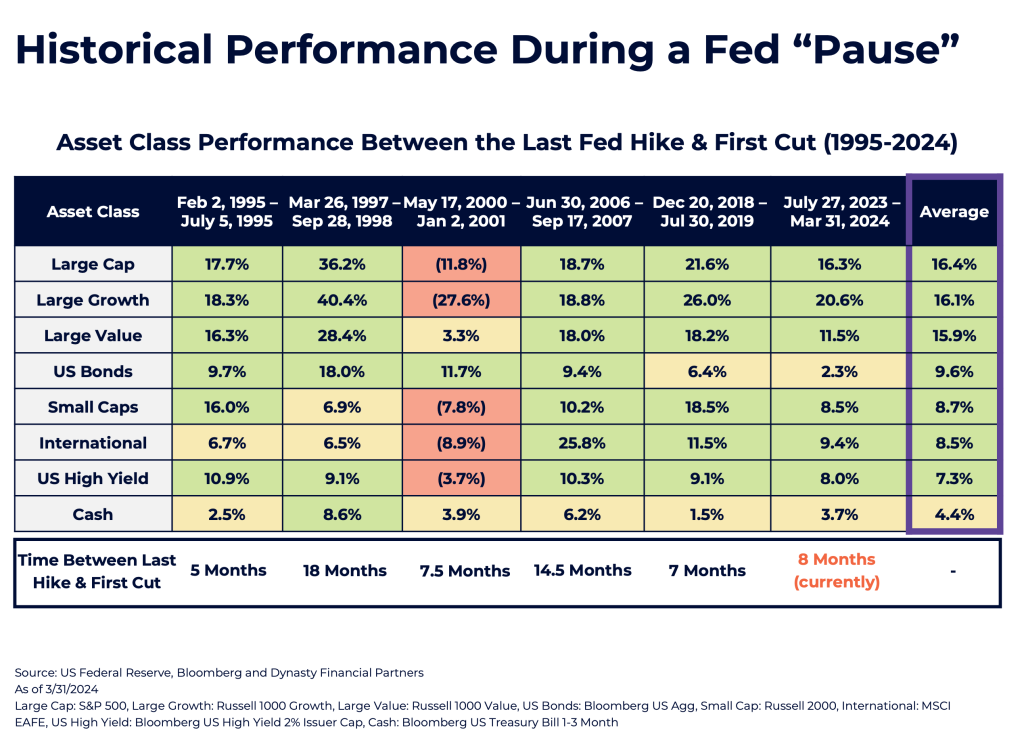
As the market turns its attention to rate cuts, the next question is when will the Fed begin cutting interest rates? In looking back over the past 30 years, the Fed has averaged roughly 10 months between the last hike and first cut. Given the last rate hike in this cycle occurred in July 2023, this would put the Fed on pace to beginning cutting in May 2024. It’s important to note the Fed historically has cut as early as 5 months after the last hike, and as late as 18 months (dating back to 1995).
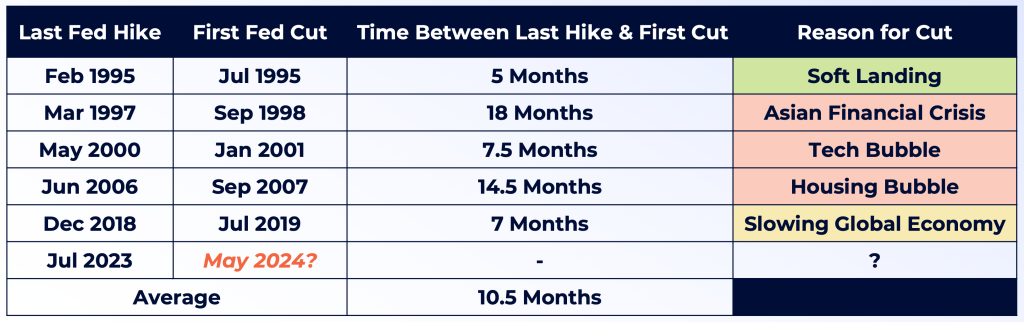
Source: US Federal Reserve & Bloomberg, As of 12/31/2023, Projection for May 2024 Rate Cut is based on historical average between last Fed hike & first cut
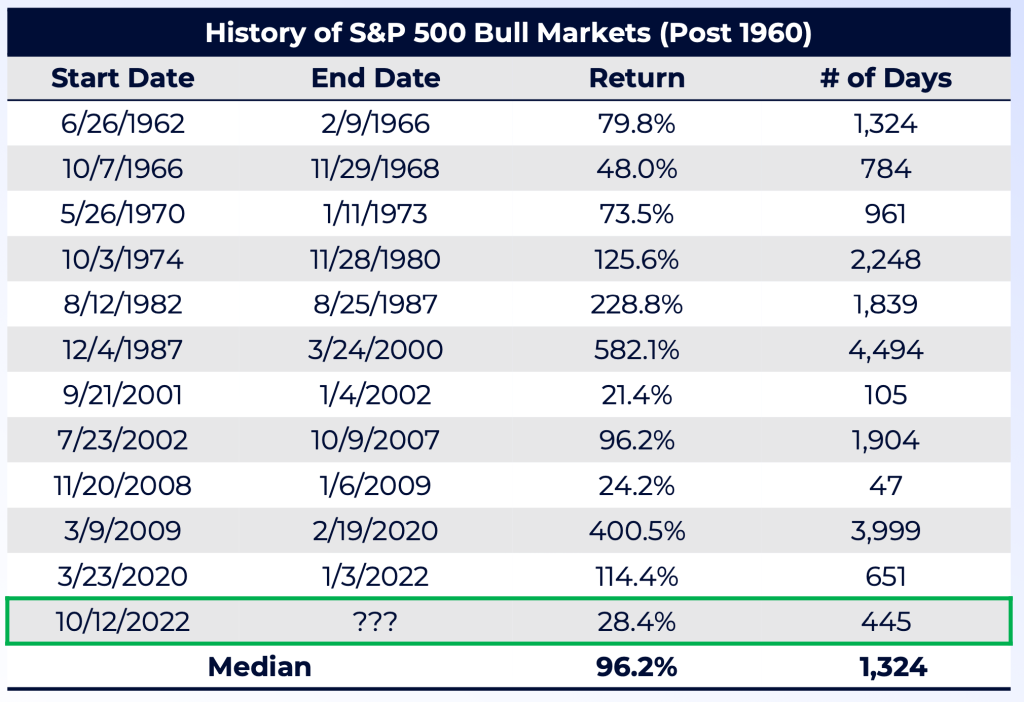
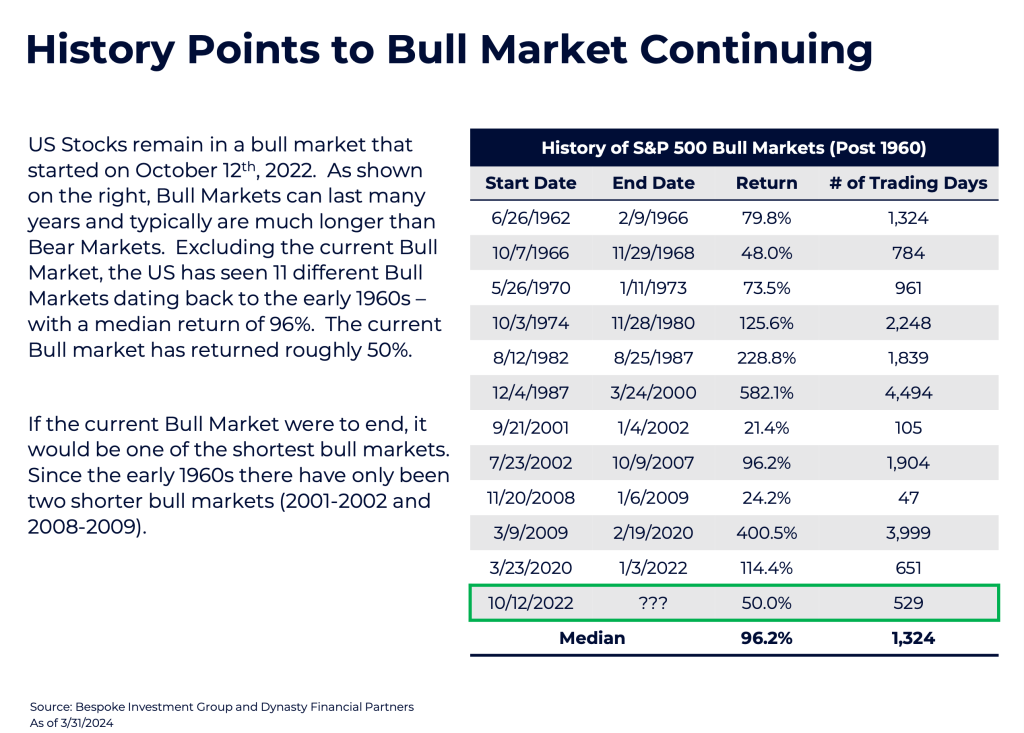
Despite volatility in 2023, US Stocks remain in a bull market that technically started on October 12th, 2022.
As shown on the right, Bull Markets can last many years and typically are much longer than Bear Markets. Excluding the current Bull Market, the US has seen 11 different Bull Markets dating back to the early 1960s – with a median return of 96%. The current Bull market has only returned 28%.
If the current Bull Market were to end, it would be one of the weakest and shortest bull markets. Since the early 1960s there there have only been two shorter bull markets (2001-2002 and 2008-2009).
1. Expect Volatility to Return Early in 2024:
Volatility was historically low in 2023 despite major geopolitical events and a hawkish Fed. In 2023 there were only two trading days where the S&P 500 saw +/- 2% moves compared to 46 trading days in 2022. We expect volatility to return early in 2024.
2. Presidential Election Years Historically Strong for Equities: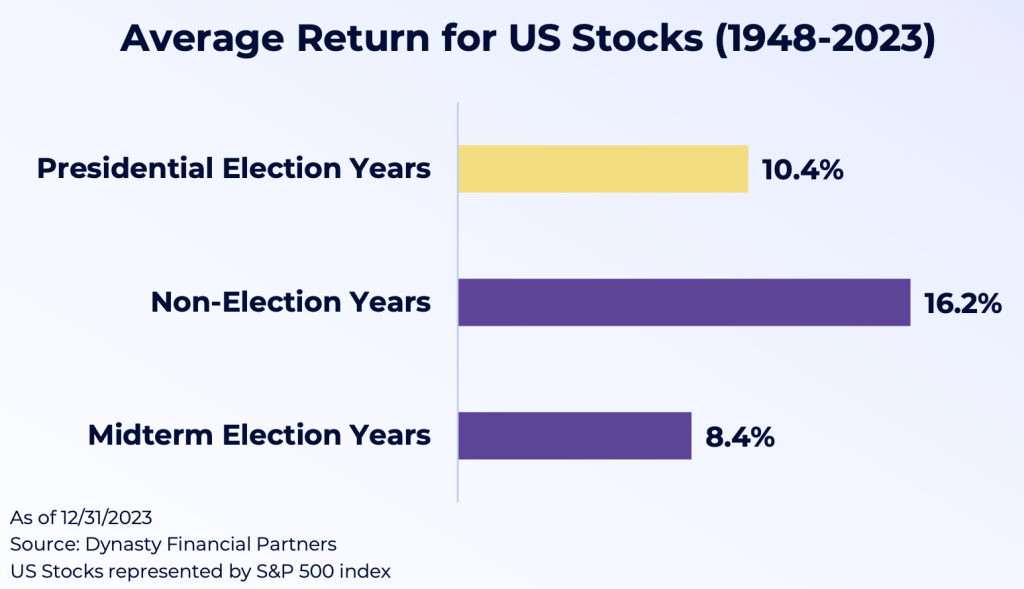
The strongest equity returns during a 4-year Presidential cycle have historically occurred during Non-Election Years, averaging 16.2% dating back to 1948. We witnessed this in 2023 with the S&P 500 rallying roughly 26%. Looking to 2024, Presidential Election years have averaged returns of 10.4%.
In next year’s Presidential Election, we expect a rematch of 2020. President Trump may all but lock up the Republican Nomination by “Super Tuesday” (March 5th) if he performs strongly in the first four primaries (Iowa, New Hampshire, Nevada, and South Carolina). We also expect President Biden to re-run barring any health concerns.
3. Small Caps Have Attractive Valuations:
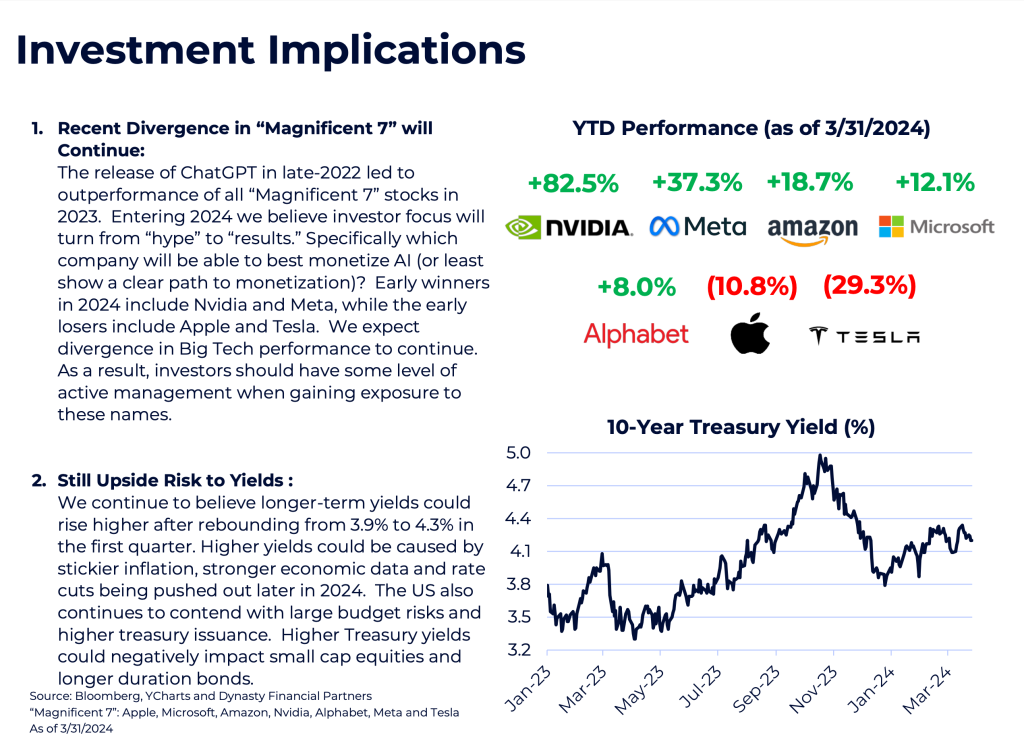
The outperformance in Big Tech and Large Caps in 2023 has led to higher valuations. The Magnificent 7 have forward P/E ratios between 18x and 62x earnings. If we strip out these seven names, the remaining stocks in the S&P 500 have a median forward P/E of 17.4x. Despite the rally in Small Caps to end the year, the S&P 600 trades at just 15.0x. If the Fed can navigate a “soft landing,” we could see Smalls Caps continue to outperform.
4. Upside Risk to Yields: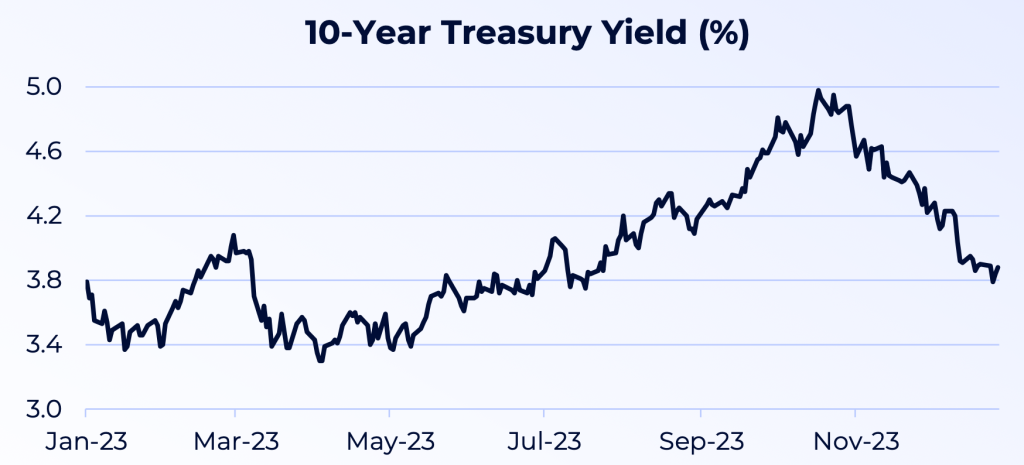
The bond market panicked into year-end and priced in a Recession and six rate cuts in 2024. We believe the chances of both happening are low. We especially feel a 10-year yield below 4% is too low compared to inflation expectations and real interest rates. Upside risks to yields also include large budget deficits and increasing treasury issuance.
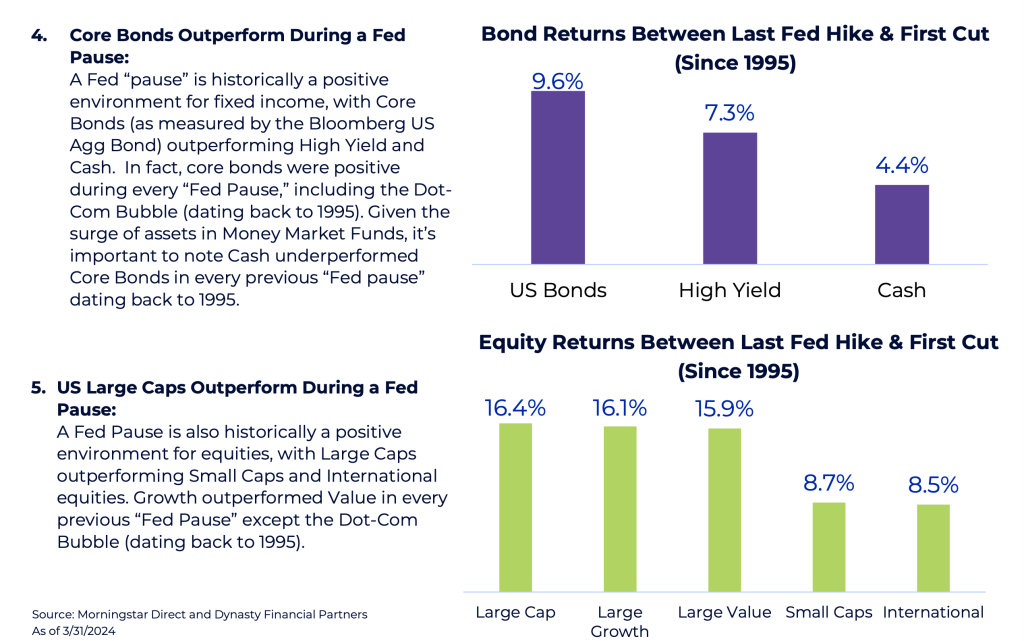
5. Core Bonds Outperform During a Fed Pause: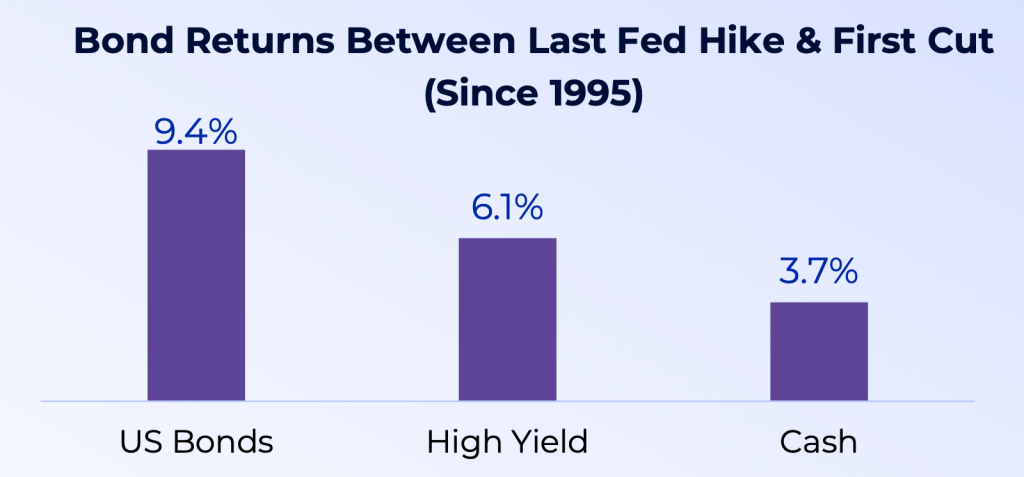
A Fed “pause” is historically a positive environment for fixed income, with Core Bonds (as measured by the Bloomberg US Agg Bond) outperforming High Yield and Cash. In fact, core bonds were positive during every “Fed Pause,” including the Dot-Com Bubble (dating back to 1995). Given the surge of assets in Money Market Funds, it’s important to note Cash underperformed in every “Fed pause” dating back to 1995.
6. US Large Caps Outperform During a Fed Pause: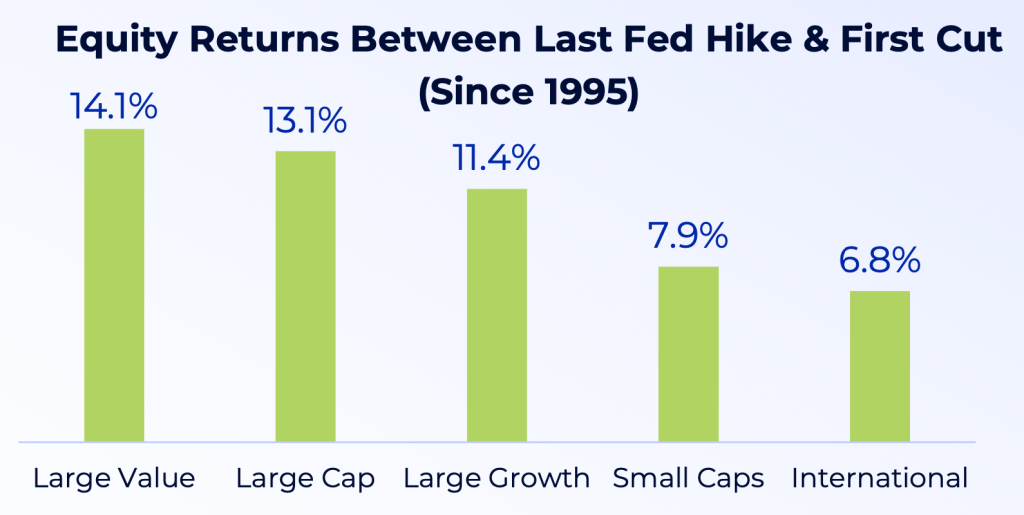
A Fed Pause is also historically a positive environment for equities, with Large Caps outperforming Small Caps and International equities. Large Value was the best performer and was positive during every “Fed Pause,” including the Dot-Com Bubble (dating back to 1995).
US Stocks fell -3.3% in the third quarter and experienced their first negative quarter since Q3 of 2022. While equities surged in July, the market was hit with bad news throughout August and September, starting with the downgrade of the US Debt Rating by Fitch on August 1st. Moody’s quickly followed with downgrades of several small-to-midsized banks. Other negative news included a property crisis in China, surging Oil Prices and Treasury Yields, stickier inflation, a rising US Dollar and a “hawkish pause” by the Federal Reserve.
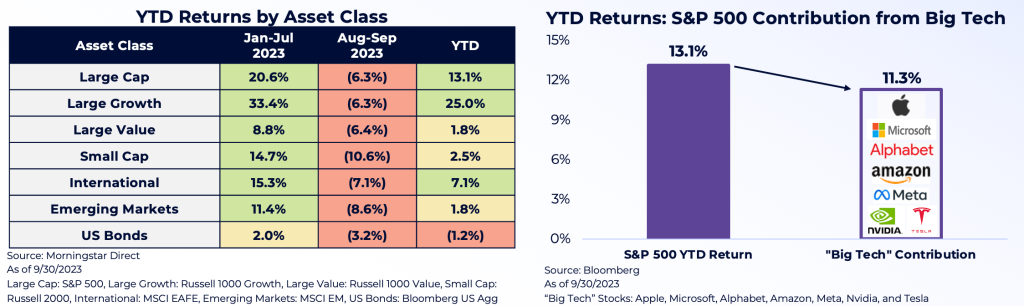
As shown below, all major asset classes experienced negative returns in August & September. International equities were hit harder than the US, in part due to a rising US Dollar and a slowdown in China. Most concerning to investors continues to be signals from the Bond Market and narrow breadth in the equity market. While the S&P 500 is up 13% in 2023, the majority of those returns (11.3%) have come from the “Magnificent 7” (Apple, Microsoft, Alphabet, Amazon, Meta, Nvidia, and Tesla).
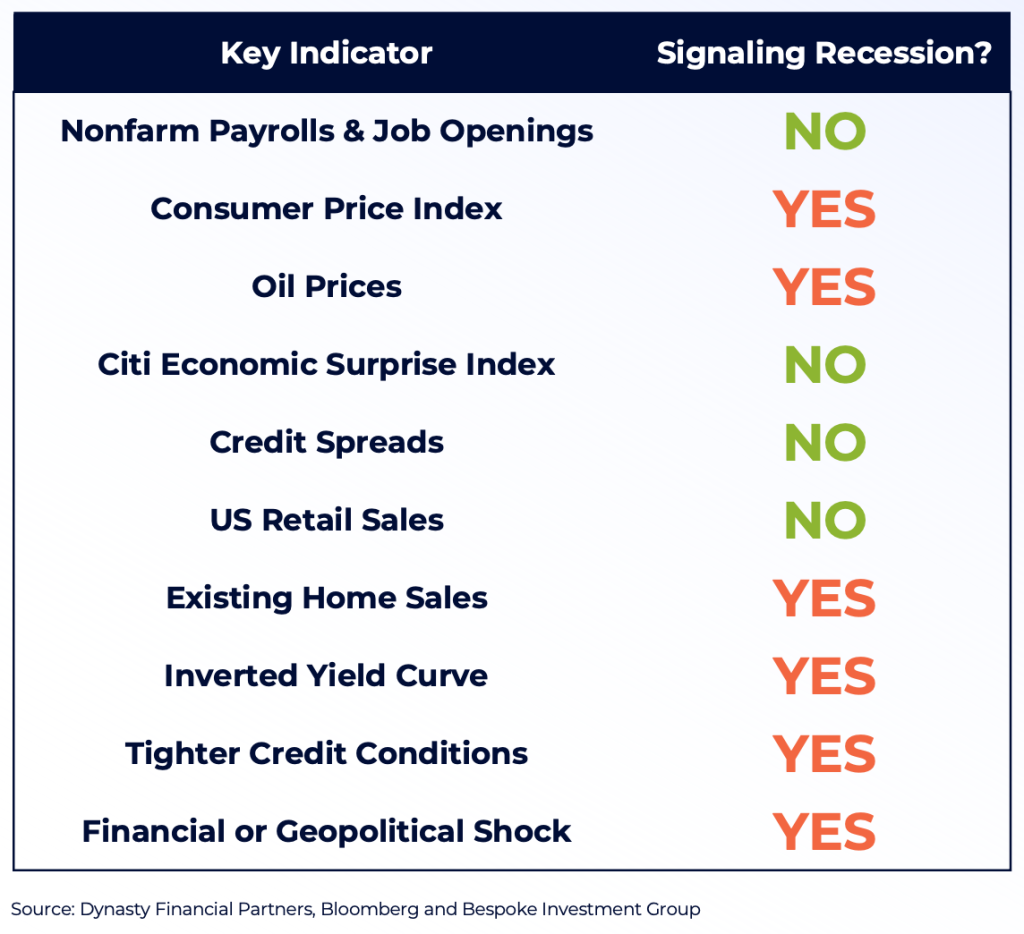 The market continues to send mixed messages regarding a possible Recession, with warning signs including:
Despite these headwinds the overall economy has proven resilient, particularly with the labor market and strength of the consumer. The Unemployment rate remains below 4.0% and the number of Job Openings remains elevated. Consumers still have cash on their balance sheets and have been supported by locking in lower mortgage rates.
The Citi Economic Surprise Index, which shows if economic data is coming in above or below expectations, remains high – a positive sign for the economy. And while many bond indicators are flashing warnings signs, credit spreads remain low.
Monetary policy historically operates with a lagged effect on the economy. This makes it much tricker for Fed officials and investors to determine when or if a Recession may start. The Fed has raised interest rates to the highest level sine 2006 and we believe the lag from higher interest rates is starting to slow the economy. As mentioned previously, we are starting to see:
Every US Recession since the 1950s has been preceded by an inverted yield curve. The 10-year and 3-month yield curve is closely watched by investors and has been inverted for 222 consecutive trading days – its longest inversion on record. History shows a Recession begins much later after a yield curve initially inverts. In fact, the average number of days from the first date of inversion to the start of a Recession has been 589 days (dating back to the late-1960s). The current yield curve inversion reached its maximum inversion after the Regional Banking Crisis on May 3rd. Since then, the yield curve has steepened. Historically the number of days from peak yield curve inversion to the start of a Recession has averaged 395 days.
While the Fed left rates unchanged at its last meeting on September 20th, Chair Powell delivered a strong message to the markets that additional rate hikes are on the table. Hawkish commentary at his press conference included:
Yields surged in response to Powell’s comments and the Fed’s updated “Dot Plot” – which showed 12 of 19 voting participants expecting one additional rate hike in 2023. Many participants only expect 1-2 rate cuts in 2024 as well.
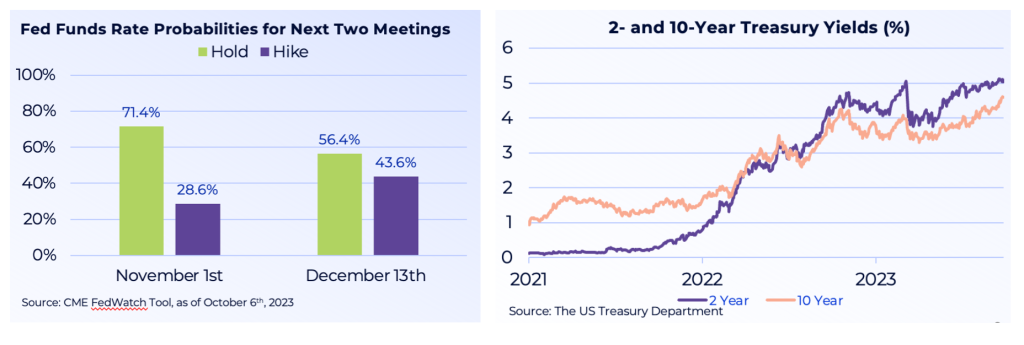
The market continues to believe the Fed will hold rates steady at its last two meetings of the year, according to the CME FedWatch Tool. As shown below, the market only sees a 28% chance of a hike at the November 1st meeting and a 43% chance of a hike at the December 13th meeting.
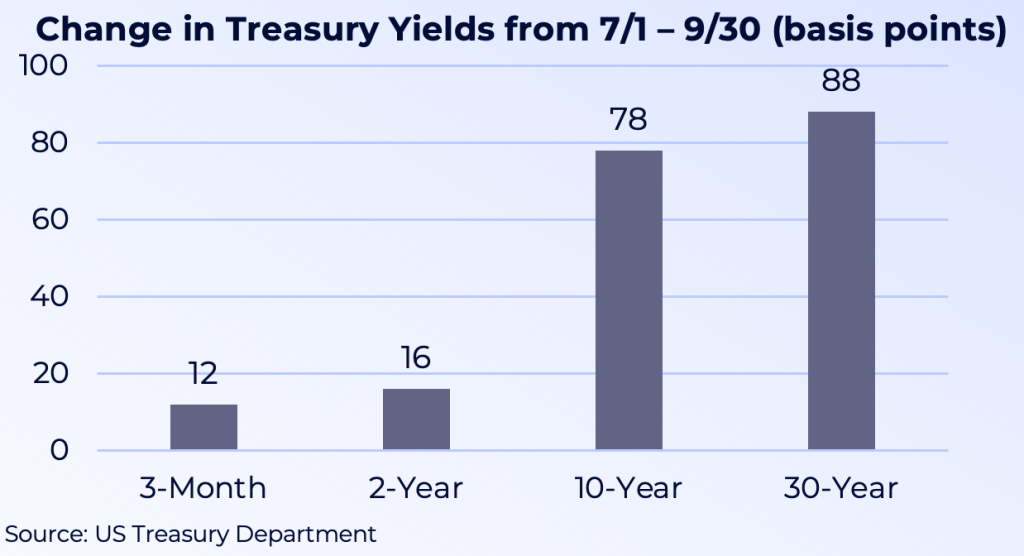 The steepening of the yield curve has been led by the surge in long-term Treasury yields. At the short-end of the curve, 3-month and 2-year yields are up 12 and 16 basis points since July 1st. But 10-year and 30-year Treasury yields have surged 78 and 88 basis points, respectively. Particularly concerning is how long-duration US Treasuries have not been rallying on good news. Instead, long-term Treasuries (as measured by the iShares 20+ Year Treasuries ETF) have experienced a drawdown exceeding 50% from their August 2020 highs.
Why are long-term yields surging? Below we highlight the major reasons:
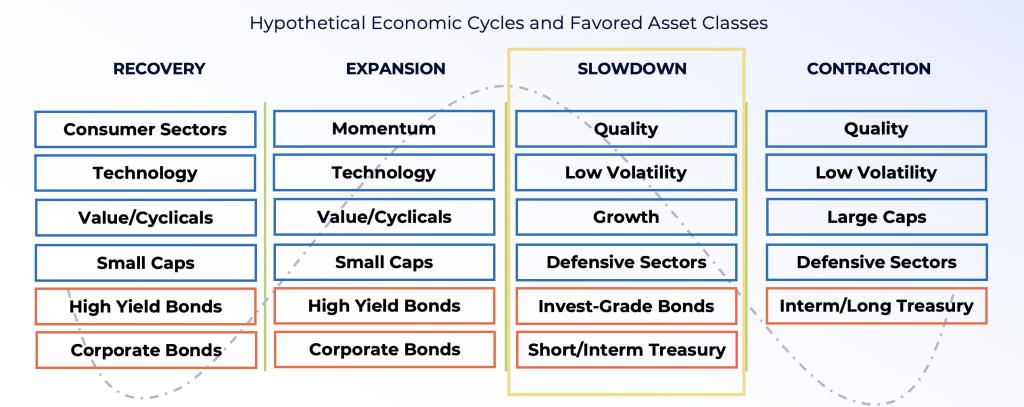
We believe the economy is approaching a Fed-induced slowdown. Ultimately the Fed will not stop hiking rates until the labor market cools, unemployment rises, and Fed members feel confident inflation is on its way back to its 2% mandate. As the economy slows down, we favor tilting equity portfolios towards High Quality and Low Volatility stocks, as well as Growth over Value. In terms of Fixed Income, we continue to favor high quality corporate bonds and short duration Treasuries. As the economy starts to slow, we believe investors can gradually extend portfolio duration.
 Hope for a Soft Landing, but Prepare for a Hard Landing. Our original forecast at the beginning of the year of “higher for longer” rates has panned out. We expect CPI to remain sticker between 3.0%-4.0% for the remainder of the year due to base effects. The Fed is determined to get inflation back down to its 2% goal, and will use hawkish rhetoric or even another rate hike in 2023 to accomplish its goal. Since the Fed’s “hawkish pause” at its September 20th meeting, yields have surged. We believe we are approaching a slowdown and recommend utilizing the playbook on the previous slide, such as high quality equities and short duration bonds.
Short-Term Treasuries Still Attractive and Consider Private Credit: Yields have run up significantly, with the 2-Year yield at the highest levels since 2006. The Fed controls the short-end of the curve and is nearing the end of its rate hiking cycle, which could result in lower yields. In addition, possible labor market softness and a slowing economy in Q4 could benefit Treasuries. We also believe investors should consider Private Credit. Banks have been under pressure to shore up their Balance Sheets and cut bank on lending. This has provided a huge opportunity for Private Credit to fill in the gap.
“There is an Alternative” – Underweight High Dividend Equities: Investors were accustomed to the acronym “TINA” (There is No Alternative) when interest rates were close to zero and equities seemed like the only attractive investment. But a surge in Treasury yields north of 5% are now challenging equities. As a result, higher dividend equities have come under significant pressure in 2023. The Utilities sector (measured by the Utilities Sector SPDR ETF) alone was down -9.2% in Q3 due to competition from the bond market. In fact, the spread in YTD performance between Utilities and the S&P 500 is over 30%, which is the second-biggest year of underperformance dating back to 1941. We recommend underweighting higher yielding equities. As shown on the right, the highest 100 dividend-yielding stocks in the S&P 500 are down on average -11.3%, while the 101 Non-Dividend payers in the S&P 500 are up 11.6%.
There are powerful price and seasonality trends that cannot be ignored. September lived up to its reputation as the weakest month of the year for equities on a seasonal basis, but October-December is historically the strongest 3-month stretch of the year. The fourth quarter has averaged a gain of 4.1% for the S&P 500 going back to 1945, which is double the next best performing quarter. Also worth noting is the 3rd year of a Presidential cycle has historically produced the strongest equity returns in a four-year cycle. While we expect volatility in October, we would not be surprised to see equities rally into year-end.
US over Developed Europe. Developed Europe is following the US in hiking rates, but we feel the US economy is proving more resilient and closer to the end of its rate hiking cycle. For example, Germany is the largest exporter to China in Developed Europe, but now faces the risk of an economic slowdown home and abroad. German 10-year yields also hit the highest levels since 2011.
Don’t Fight the AI Secular Wave, but Don’t Chase Either. Tech stocks have come under pressure in August & September along with the overall market. Despite the selloff, we would not be surprised to see Tech lead the market higher in Q4. We caution investors who are underweight Artificial Intelligence, as we believe this secular theme is still in the early innings. As mentioned earlier, the “Magnificent 7” has made up over 80% of the S&P 500’s YTD returns. Investors have also utilized Big Tech as a flight to safety over Utilities & Staples – a trend that may continue in Q4.
US Stocks are officially confirmed to be in a Bull Market, with the S&P 500 rallying 20+% from
the low on October 12th, 2022. As a reminder, stocks dropped -24% in the latest Bear Market
that started on January 3rd, 2022 and lasted roughly 9 months. Recently, the S&P 500 has
continued to post a series of “higher highs and higher lows”, while trading above its 200-day
moving average. The market’s resilience has been impressive considering regional bank failures,
fears of a US Recession, a disappointing China reopening, Debt Ceiling negotiations, and rising
rates. As shown on the right, Bull Markets can last many years and typically are much longer
than Bear Markets. Excluding the current Bull Market, the US has seen 14 different Bull
Markets dating back to World War II – with a median return of 91%.
Volatility in the equity markets has remained surprisingly muted (as measured by the VIX). As a
reminder, the Volatility Index (VIX) measures one-month expected volatility of the S&P 500
using the equity index options. The VIX index closed below 15 for the first time since February
2020, breaking a streak of 835 trading days! Meanwhile, the MOVE Index (which measures
one-month implied volatility of US Treasury market) has remained elevated. This divergence
between the VIX and MOVE is highly unusual. Bond market volatility could be contributed to
the regional banking crisis or fears of a Government default, but these issues were either
contained so far (Banking Crisis) or resolved (raising Debt Ceiling). Ultimately the Bond Market
may be signaling concerns around inflation, further Fed tightening, and tight credit and lending
conditions.
Despite the Regional Banking Crisis, the Nasdaq continued to rally in Q2 and finished the first
half of 2023 up 32.3%. The overall strength in Big Tech this year can be contributed to : 1)
anticipation of a Fed “pause”, 2) a flight to safety during the Banking Crisis, and 3) buzz around
Artificial Intelligence. The introduction of ChatGPT in late-2022 opened investors eyes (and the
entire world) to the potential of AI, particularly around productivity gains. ChatGPT was created
by OpenAI and uses advanced language technology to create human-like responses, original
ideas, and content. Once released, it reached one million users in just 5 days! This is faster
than any other online application in history, including Instagram (2.5 months) and Facebook (10
months). The excitement propelled Growth stocks associated with AI, including Microsoft (who
partnered with OpenAI) and Nvidia (whose GPU chips power AI).
What has made this Bull Market so unique is the bulk of this year’s S&P 500 returns have come
from the seven largest Big Tech stocks (Apple, Microsoft, Alphabet, Amazon, Nvidia, Tesla, and
Meta). In fact, these seven names accounted for roughly 75% of the S&P 500’s YTD return (see
below).
Despite the narrow rally in the first five months of the year, we have seen bullish signs of the
equity rally broadening in June beyond Growth names. For example, Large Growth surged
20.8% in the first five months of the year, while Large Value (-1.4%) and Small Caps (-0.1%)
were negative. In June, Large Value (+6.6%) and Small Caps (+8.1%) both rallied. Most
reassuring may be the June rally in sectors that are tied to either the strength of the consumer,
such as Cons. Discretionary (+12.1%), or the health of the economy, such as Industrials
(+11.3%). Meanwhile, more defensive sectors have underperformed in June, such as Consumer
Staples (+3.2%) and Utilities (+1.6%).
As mentioned last quarter, equities historically have rallied after the last rate hike in a cycle. The
Fed left rates unchanged in June for the first time since January 2022, after a streak of ten
straight meetings with rate hikes. This is one of the longest streaks of consecutive rate hikes,
with the record being 17 straight hikes in the early 2000s. Despite the “pause,” Fed officials all
but indicated they expect 1 to 2 more rate hikes
in 2023, with Fed Chair Powell noting the July
meeting “will be live.” The reason for the
temporary pause was due to the lagging effect
on the economy when raising rates, and for Fed
officials to monitor incoming data. Recently
Powell has indicated policy “may not be
restrictive enough.” If the Fed raises rates two
more times, the Fed Funds Rate would reach a
level of 5.50%-5.75%. According to the CME
FedWatch Tool, the market is currently pricing
in an 89% chance of a 25 basis point hike in July, but just an 18% chance the Fed will hike again
in September (see below chart).
Despite projecting additional hikes, it appears the Fed is nearing the end of its rate hiking cycle.
In looking at the past 30 years (going back to 1994), there have been five prior rate hiking cycles
– including the current cycle. In the prior four cycles, equities rallied in the following 12 months
after the last rate hike (except in 2000 during the Tech Bubble).
CPI only rose 0.1% month-over-month in May,
with the year-over-year figure dropping to
4.0%. Falling food prices and stable energy
prices have contributed to the drop in CPI.
Fears over oil shortages proved to be unfounded
despite production cuts by OPEC+ (April) and
Saudi Arabia (June). Despite CPI dropping from
a high of 9.1% last June, Core CPI (which
excludes food and energy) has remained stickier
and caught the attention of the Fed. Last month,
Core CPI rose 0.4% month-over-month and
5.3% year-over-year (from 5.4% the previous
month). The Fed remains adamant that their Fed
Funds Target is 2% and has signaled more
demand destruction is needed to bring down CPI. One potential warning sign for Fed Officials is
inflation re-accelerating, which the UK is currently experiencing.
When we look at the different components of Core CPI versus their year-over-year inflation
rates, Shelter and Owners Equivalent Rent continue to exhibit the most upward pressure on
inflation. New Home Sales recently climbed at the fastest pace in over a year and US Housing
Starts soared over 21% in May. Motor Vehicle Repairs and Transportation Services have some
of the highest inflation rates. In general, Services are less sensitive to interest rates and are still
experiencing structural tailwinds after Covid.
Despite positivity in the equity markets, the bond market continues to tell a completely different
story. Yield curves remain massively inverted and signal Recession fears. Normally longer-term
yields are higher due to uncertainty over inflation and interest rates. Currently, however, over
80% of the yield curve is inverted as short-term yields surged over expectations of elevated rates.
Since 1980, every time this number was over 80%, a Recession followed.
Why are Bond Markets so cautious? There are many lingering concerns:
• Tighter Lending Standards as a result of the regional banking crisis and concerns
around the availability of credit to small- and medium-sized businesses
• Commercial Real Estate (CRE) market due to the popularity of “work from home” and
the fact the CRE market depends on loans from smaller banks.
• Stickier inflation and the Fed tipping the economy into a Recession through higher rates.
• Worrisome Economic Data, including eight straight months of the ISM Manufacturing
data in contraction territory (<50.0). The latest reading (46.0) is the weakest level since
May 2020.
Every US Recession since the 1950s has been preceded by an inverted yield curve. The 10-year
and 2-year yield curve is closely watched by investors and is at its most inverted level since the
early 1980s. It is important to note there is usually a delay between the time of inversion and
beginning of Recession. For example, following the inversion of the 10-year and 2-year yield
curve, a Recession historically followed by as little as six months or as much as two years (since
1955). The current inversion began in July 2022.
Our original forecast of “higher for longer” rates at the beginning
of the year is panning out. The Fed’s updated Dot Plot shows 1-2
more rate hike in 2023 and then holding rates steady into 2024. The
Fed’s view is still consistent with an “Inflationary Boom” scenario, in
which economic growth continues at a relatively brisk clip with inflation
remaining above the Fed’s target into 2024. The market however seems
to be pricing in a “Deflationary Boom.” Last quarter we favored the
scenario where “banking stresses are successfully contained, the US economy avoids a near-term
Recession, and the Fed doesn’t move aggressively.” We largely still agree with this view, even
thought we expect 1-2 more rate hikes, starting in July.
Maintain positioning in high quality stocks. We are still cautious on this market, given
warnings in the Bond Market, a lack of volatility in the equity markets, and a run up in
valuations (S&P 500 trades at roughly 19x). We believe investors should avoid complacency and
monitor positions and sizes to avoid becoming overexposed to certain first half outperformers,
such as Big Tech and Semis.
Targeted Fiscal Stimulus Will Benefit Certain Industries: $2 Trillion in government spending
will support Infrastructure, including Energy Transformation and domestic manufacturing (i.e.
Semi industry).
There are powerful price and seasonality trends that cannot be ignored. Bull Markets last
much longer than Bear Markets, and we potentially could be in the early stages of a Bull market
that officially started in October 2022. As stated earlier, a strong first half to a year (>10%)
historically leads to strong second half returns. Finally, the 3rd year of a Presidential cycle has
historically produced the strongest equity returns in a four year cycle. On the other hand, Year 2
of a Presidential cycle is the weakest for equity returns.
The US isn’t the only Bull Market: Maintain global diversification. Japan is in the third
longest Bull Market in its history due to loose monetary policy, yield curve control, renewed
foreign interest, and a more shareholder friendly approach by companies. India is another Bull
Market and is one of the fastest growing countries in the world.
US over Developed Europe. The US is closer to the end of its rate hiking cycle than Europe,
which is dealing with sticker inflation (and in some cases accelerating inflation). For example,
the Bank of England announced a surprise 50 basis point hike after Core CPI rose at its fastest
pace since 1992. It’s possible the European Central Bank and Bank of England continue hiking
rates beyond when the Fed pauses. Low Natural Gas prices also have benefited Europe in 2023,
but prices rallied in June.
Don’t give up on Fixed Income, and maintain a barbell approach between US Treasuries &
Credit. 2022 was an extremely unusual year for fixed income, as US Treasuries and Credit
delivered multiple quarters of negative returns together. Historically they move in different
directions, as Government bonds tend to do well when the economy is slowing and inflation is
cooling, while Credit typically outperforms in a growing economy.
The Debt Ceiling is the amount of money the US Department of the Treasury is authorized to borrow to pay the nation’s bills. These bills include Social Security, Medicare, and interest on outstanding national debt. Congress regularly raises the US Debt Ceiling so the US can borrow more, but occasionally this process becomes political.
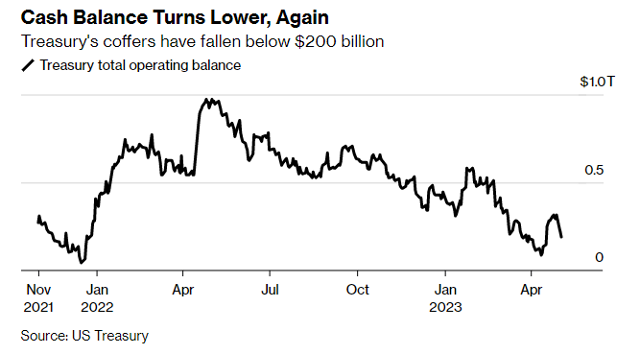
The current Debt Ceiling is roughly $31.4 Trillion, and the US hit that borrowing limit in January 2023. However, the US Treasury can use “extraordinary measures” to continue paying its bills in the short-term, including deferring contributions to pension funds. Incoming tax receipts from the April Tax deadline will raise the level of cash on hand at the Treasury, but eventually the Debt Ceiling will need to be raised. After reviewing Tax Receipts, the Treasury has greater clarity on when it would run out of Cash and technically default (known as the “X-Date”).” Treasury Secretary Yellen recently warned the X-Date could hit as early as June 1st.
All eyes turn to lawmakers. After Yellen’s announcement, President Biden announced a May 9th meeting with top Congressional leaders including House Speaker Kevin McCarthy. Further complicating matters, the House in only in session 12 days this month, while the Senate is in session 14 days (with only 7 of those days overlapping). A last resort option could be President Biden invoking the 14th Amendment and raising the Debt Ceiling on his own. There remains much uncertainty about the legality of such a move.
The consequences of the US not raising the Debt Ceiling in time would be unprecedented, as the US has never intentionally defaulted on its debt. Investors are currently demanding a significant premium for Treasuries maturing around the X-Date, as those Treasuries could technically not be re-paid on time in the event of a default. Currently a 1-month Treasury is yielding 5.4% – the highest level in decades.
Along with delayed interest payments for certain Treasury holders, other significant consequences of a default could include:
The 2011 Debt Ceiling Crisis was the last time the US came close to intentionally defaulting, as Congress raised the Debt Ceiling just days before the X-Date. At that time, Congress was so gridlocked that Standard & Poor’s downgraded the AAA credit rating of US Treasuries. During this crisis, the S&P 500 fell nearly 17% in less than a month.
In summary, we expect the Debt Ceiling to be raised before the X-Date, which could occur sometime in June. Nonetheless, the upcoming negotiations between lawmakers may not produce a resolution until the eleventh hour, resulting in volatility and political noise. Still, the political fallout of an intentional default remains too risky for both Republicans and Democrats, and a deal remains the most likely outcome.
Sources: Bloomberg, CNBC, Wall Street Journal and Dynasty Financial Partners
This message is intended for the exclusive use of members or prospective members considering joining the Dynasty Network of registered investment advisers. The views expressed in the referenced materials are subject to change based on market and other conditions. This document contains certain statements that may be deemed forward-looking statements. Please note that any such statements are not guarantees of any future performance; actual results or developments may differ materially from those projected. Any projections, market outlooks, or estimates are based upon certain assumptions and should not be construed as indicative of actual events that will occur. Certain information contained herein has been obtained from third-party sources and has not been independently verified. The information shared in this document should not be construed as an attempt to sell or solicit any products or services nor should it be construed as legal, accounting, tax or other professional advice.
Have you ever reflected on the foundation of the financial system? What comes to mind? Banks, investors, the stock market, the bond market, or the credit markets? That’s partially true. They are the underpinnings, but the foundation or the bedrock of the financial system is confidence. Without confidence, we are left in a very precarious situation.
 We have full confidence that when we withdraw cash from a bank account or money market fund, or for that matter, close out an account, we will have immediate access to those funds. But bank vaults aren’t filled with cash that can be easily repatriated to depositors if, by an incredible long shot, everyone shows up one day to close their account. Our deposits are invested in high-quality bonds, Treasury bills, and loans.
What happened at Silicon Valley Bank last month was simply an old-fashioned bank run. Why? Confidence quickly evaporated. But the root cause of its demise had many regulators, investors, and Fed officials scratching their heads because nearly everyone was caught off guard.
Unlike 2008, when major banks were saddled with bad real estate loans, SVB invested heavily in a portfolio of high-quality, longer-term Treasury bonds. From a credit standpoint, these are super-safe investments. What could go wrong? Well, nothing if the bonds were held to maturity or if interest rates had remained stable.
Bond prices and bond yields move in the opposite direction. When yields rose, the bonds fell in value, creating a paper loss. But its customer base of venture capital investors had been drawing down on their deposits as more traditional sources of funding were drying up. With deposits being drawn down, SVB was forced to sell $21 billion in bonds, and the bank took a nearly $2.0 billion loss. SVB’s hastily announced plan to raise capital was quickly scuttled when its stock tumbled, and depositors quickly began to withdraw cash, since a large majority of the bank’s deposits were above the FDIC limit.
Less than two days after the bank revealed its loss on the sale of Treasuries, regulators were forced to shut the bank. Time to failure: less than 48 hours from a late March 8th announcement of its plans to raise capital and a morning shuttering on March 10th.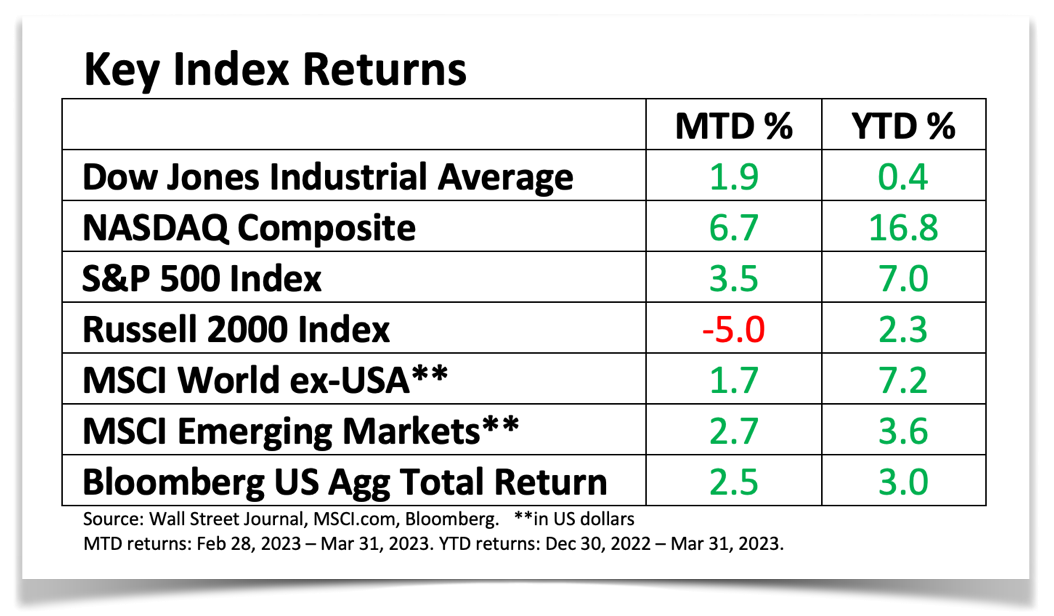
As controversial as it was, Treasury and Fed officials fretted over the potential of massive bank runs when markets opened on Monday. It’s difficult to estimate the carnage we might have seen on Monday morning, but the plan to ring-fence the banks with deposit guarantees and a new lending facility from the Federal Reserve helped contain the crisis and prevent contagion.
As the month came to a close, worries began to subside, and it was reflected in most of the major market indexes.
Regulators will dive into the details for a more thorough understanding of what happened, but the finger-pointing has already begun. Nonetheless, the impact may be felt for quite some time.
The Fed was probably on track to boost the fed funds rate by 50 basis points (bp, 1 bp =0.01%) to 5.00%- 5.25% at its March meeting. Inflation remains stubbornly high, but the Fed wisely chose to defer to banking stability, and opted for a cosmetic hike of 25 bp. It gives the appearance that inflation remains a priority, while focusing on the banking system. It also puts the Fed in a difficult position, as it hopes to tackle two conflicting goals: fighting inflation with rate hikes, which would put added stress on banks, or concentrating on financial stability.
The crisis might do the Fed’s job for it, as tighter lending standards slow economic growth. How much? No one knows. Inflation hasn’t been squashed, but problems with SVB have not spread to other banks. The crisis eased as the month came to a close, and most of the assets of the failed banks were purchased.
In recent days, sentiment has shifted on rates, but sentiment is ever-shifting. How the Fed reacts this year will depend on economic performance. As the months came to a close, fears have waned, helping shares rally, and the month ended on a favorable note.
Unfortunately, there is still quite a bit of macro uncertainty. Will the Fed raise rates again? Are we headed into a recession? Are there potential rate cuts in the near future? Will the consumer continue to remain strong in this environment?
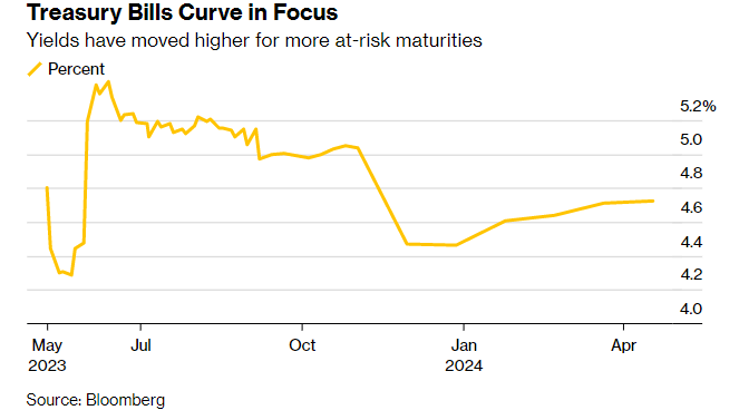
Ask two different financial experts these questions and you will most likely get two completely different answers. One area where there is some certainty – bond yields are much higher than they have been for 10 plus years. The current yields of 4% plus for short to medium term duration is quite meaningful.
As a result, for our upcoming 2023Q2 portfolio rebalance we are shifting some of the portfolio allocations into more medium term bond allocations. This provides a steady return while the market figures out which direction it wants to go. We think rate hikes are close to an end with a likely pause after that. In the next quarter or two the market should have a better sense of the depth of any upcoming recession and any equity repricing that my be needed. Until then, a well diversified portfolio and patience are the key to weathering any uncertainty.
We trust you’ve found this review to be educational and insightful. While we caution against making changes simply based on market action, ask yourself if your tolerance for risk changed considering this year’s volatility. If so, or if you have any questions or would like to discuss any matters, please feel free to give us a call. We are always here to assist you, answer your questions, and tailor any advice to your needs. Additionally, feel free to reach out to your tax advisor with any tax-related questions.
As always, we thank you for the trust, confidence, and the opportunity to serve as your financial advisors.
We trust everyone had a wonderful holiday season. Whether you reached your personal goals last year or faced challenges, a new year brings new opportunities and a fresh start. 2022 offered an unpleasant experience for investors. Most market averages peaked the first few days of the year then began to decline shortly after, and finished the year much lower.
The Fed’s response to stubbornly high inflation prompted the fastest series of rate hikes since 1980, according to data from the St. Louis Federal Reserve. The war in Ukraine exacerbated inflation by temporarily sending oil prices higher and lifting commodities such as wheat, and the allied response to discourage the war trickled into financial markets as well.
The domestic economy expanded, but the interest rate and inflation environment overwhelmed any tailwinds from economic and profit growth. The Dow lost only 8.8%, while the S&P 500 Index gave up 19.4%, the biggest disparity in over 60 years according to CNBC. Furthermore, the tech-heavy, growth-heavy Nasdaq tumbled amid the high-rate environment. In hindsight, it’s not surprising, as we’d expect fast-growing firms such as technology to be the most sensitive to higher interest rates. A slowdown in growth in the sector compounded problems.
Uncertainty tends to push investors towards fixed-income, as debt investing tends to involve less risk and has historically shown moderate correlation to equities. Last year was a notable exception. The yield on the 10-year Treasury bond rose from 1.63% at the beginning of the year to 3.88% by year-end (U.S. Treasury Dept). Bond prices and yields move in opposite directions, which pushed bond prices down. In fact, 2022 turned out to be the worst year in bonds since 1926.
The drop in bond prices can be traced to the sharp rate hikes from the Federal Reserve. Inflation is the root of the problem. A year ago, the Fed belatedly recognized that 2021’s surging inflation wasn’t simply transitory. The annual CPI was running at 7.0% in December 2021; it peaked at 9.1% in June, and moderated to a still-high 6.45% by December, the last available reading according to the U.S. Bureau of Labor Statistics. This bout of disinflation is welcome, but a few of months of lower readings is not a trend according to the Fed.
While the Fed appears set to slow the pace of rate increases in 2023, it has signaled that the eventual peak will last longer, as it attempts to bring the demand for goods, services, and labor into alignment with the supply of goods, services, and labor.
The bond market may disagree with the Fed’s forecast; the 10 year Treasury Note yield has been eclipsed by the 3 month Treasury Bill yield. Perhaps the bond market is predicting a pivot sooner than what the Fed officials are forecasting. A pivot may include a lowering of the federal funds rate, a change from selling long term debt off the Fed’s balance sheet to buying long term debt, and lastly a lowering of the Overnight Reverse Repurchase Facility yield which would push roughly $2.2 trillion away from the Federal Reserve facility back into the financial markets.
Of course, the Fed’s weapon of choice—higher interest rates—is a blunt instrument. It does not operate with the precision of a surgeon, and pain won’t be and hasn’t been spread evenly. This year could bring new challenges, and attention has slowly been shifting away from inflation to economic performance. More than two-thirds of the economists at 23 large financial institutions expect the U.S. to slide into recession this year, but a recession is not a foregone conclusion [[https://www.wsj.com/articles/big-banks-predict-recession-fed-pivot-in-2023-11672618563]]. A resilient labor market and a sturdy consumer could support economic growth this year, and if the bond market is correct with a pivot in the near future, easy money conditions may fuel growth.
Ultimately, we counsel that you must control what you can control. We can’t control the stock market or the economy, and we can’t control events overseas, but we can control our financial plans. For our upcoming 2023Q1 portfolio rebalance, we continue to farm defensive areas such as dividend paying value stocks, healthcare & materials. We also look for opportunities in small value and international equities as the U.S. dollar begins to decline vs. other currencies.
The Setting Every Community Up for Retirement Enhancement Act of 2019, popularly known as the SECURE Act 1.0, was signed into law in late 2019. The bill included provisions that raised the requirement for mandatory distributions from retirement accounts and increased access to retirement accounts. But it didn’t take long for Congress to enhance the landmark bill that was enacted barely three years ago. Tucked inside a recently passed 4,155-page, $1.7 trillion spending bill is another overhaul of the nation’s retirement laws.
Changing the age of the required minimum distributions. Three years ago, 1.0 increased the age for taking the required minimum distribution, or RMD, to 72 years from 70½. If you turn 72 this year, the age required for taking your RMD rises to 73 with 2.0 If you turned 72 in 2022, you’ll remain on the prior schedule.
If you turn 72 in 2023, you may delay your RMD until 2024, when you turn 73. Or you may push back your first RMD to April 1, 2025. Just be aware that you will be required to take two RMDs in 2025, one no later than April 1 and the second no later than December 31.
Starting in 2033, the age for the RMD will rise to 75.
Employees enrolled in a Roth 401(k) won’t be required to take RMDs from their Roth 401(k). That begins in 2024.
RMD penalty relief. Beginning this year, the penalty for missing an RMD is reduced to 25% from 50%. And 2.0 goes one step further. If the RMD that was missed is taken in a timely manner and the IRA account holder files an updated tax return, the penalty is reduced to 10%.
But let’s be clear, while the penalty has been reduced, you’ll still pay a penalty for missing your RMD.
A shot in the arm for employer-sponsored plans. Starting in 2025, companies that set up new 401(k) or 403(b) plans will be required to automatically enroll employees at a rate between 3% and 10% of their salary.
The new legislation also allows for automatic portability, which will encourage folks in low-balance plans to transfer their retirement account to a new employer-sponsored account rather than cash out.
In order to encourage employees to sign up, employers may offer gift cards or small cash payments. Think of it as a signing bonus.
Employees may opt out of the employer-sponsored plan.
Increased catch-up provisions. In 2025, 2.0 increases the catch-up provision for those between 60 and 63 from $6,500 in 2022 ($7,500 in 2023 if 50 or older) to $10,000, (the greater of $10,000 or 50% more than the regular catch-up amount). The amount is indexed to inflation.
Catch-up dollars are required to be made into a Roth IRA unless your wages are under $145,000.
Charitable contributions. Starting in 2023, 2.0 allows a one-time, $50,000 distribution to charities through charitable gift annuities, charitable remainder unitrusts, and charitable remainder annuity trusts. One must be 70½ or older to take advantage of this provision.
The $50,000 limit counts toward the year’s RMD.
It also indexes an annual IRA charitable distribution limit of $100,000, known as a qualified charitable distribution, or QCD, beginning in 2023.
Back-door student loan relief. Starting next year, employers are allowed to match student loan payments made by their employees. The employer’s match must be directed into a retirement account, but it is an added incentive to sock away funds for retirement.
Disaster relief. You may withdraw up to $22,000 penalty-free from an IRA or an employer-sponsored plan for federally declared disasters. Withdrawals can be repaid to the retirement account.
Help for survivors. Victims of abuse may need funds for various reasons, including cash to extricate themselves from a difficult situation. 2.0 allows a victim of domestic violence to withdraw the lesser of 50% of an account or $10,000 penalty-free.
Rollover of 529 plans. Starting in 2024 and subject to annual Roth contribution limits, assets in a 529 plan can be rolled into a Roth IRA, with a maximum lifetime limit of $35,000. The rollover must be in the name of the plan’s beneficiary. The 529 plan must be at least 15 years old.
In the past, families may have hesitated in fully funding 529s amid fears the plan could wind up being overfunded and withdrawals would be subject to a penalty. Though there is a $35,000 cap, the provision helps alleviate some of these concerns.
What we have provided here is an overview of the SECURE Act 2.0, so keep in mind that it is not all-inclusive.
We trust you’ve found this review to be educational and insightful. While we caution against making changes simply based on market action, ask yourself if your tolerance for risk changed considering this year’s volatility. If so, or if you have any questions or would like to discuss any matters, please feel free to give us a call. We are always here to assist you, answer your questions, and tailor any advice to your needs. Additionally, feel free to reach out to your tax advisor with any tax-related questions.
As always, we thank you for the trust, confidence, and the opportunity to serve as your financial advisors.
Sources: [[https://images.thinkadvisor.com/contrib/content/uploads/documents/415/479719/GA_SECURE-2.0-Act-of-2022_Section-by-Section-Summary-FINAL.pdf Secure Act 2.0 Act of 2022]]; [[https://www.fidelity.com/learning-center/personal-finance/secure-act-2 SECURE 2.0: Rethinking Retirement Savings]]; [[https://www.schwab.com/learn/story/congress-passes-major-boost-to-retirement-savings Congress Passes Major Boost to Retirement Savings]]; [[https://www.wsj.com/articles/WP-WSJ-0000441889 The 401(k) and IRA Changes to Consider After Congress Revised Many Retirement Laws]]

© 2024 Centerline Wealth Advisors. All Rights Reserved.