Centerline Market Update 2024 Q1

By | Market Analysis | No Comments

2023 Winners & Losers:

Source: Morningstar Direct, Bloomberg, Bespoke Investment Group and Dynasty Financial Partners As of 12/31/2023


S&P 500 Approaching All-Time Highs

– Four themes dominated 2023:

  • Artificial Intelligence
  • “Magnificent 7”
  • Federal Reserve
  • Inflation

– The S&P 500 ended the year on a nine-week winning streak, its longest since 2004.

– US Small Caps and Bonds were both negative YTD though October, but significantly rallied into year-end on the hopes of a 0% “soft landing” and rate cuts.


A Tale of Three Markets in 2023

January – July: Markets rallied to start 2023, in part due to:

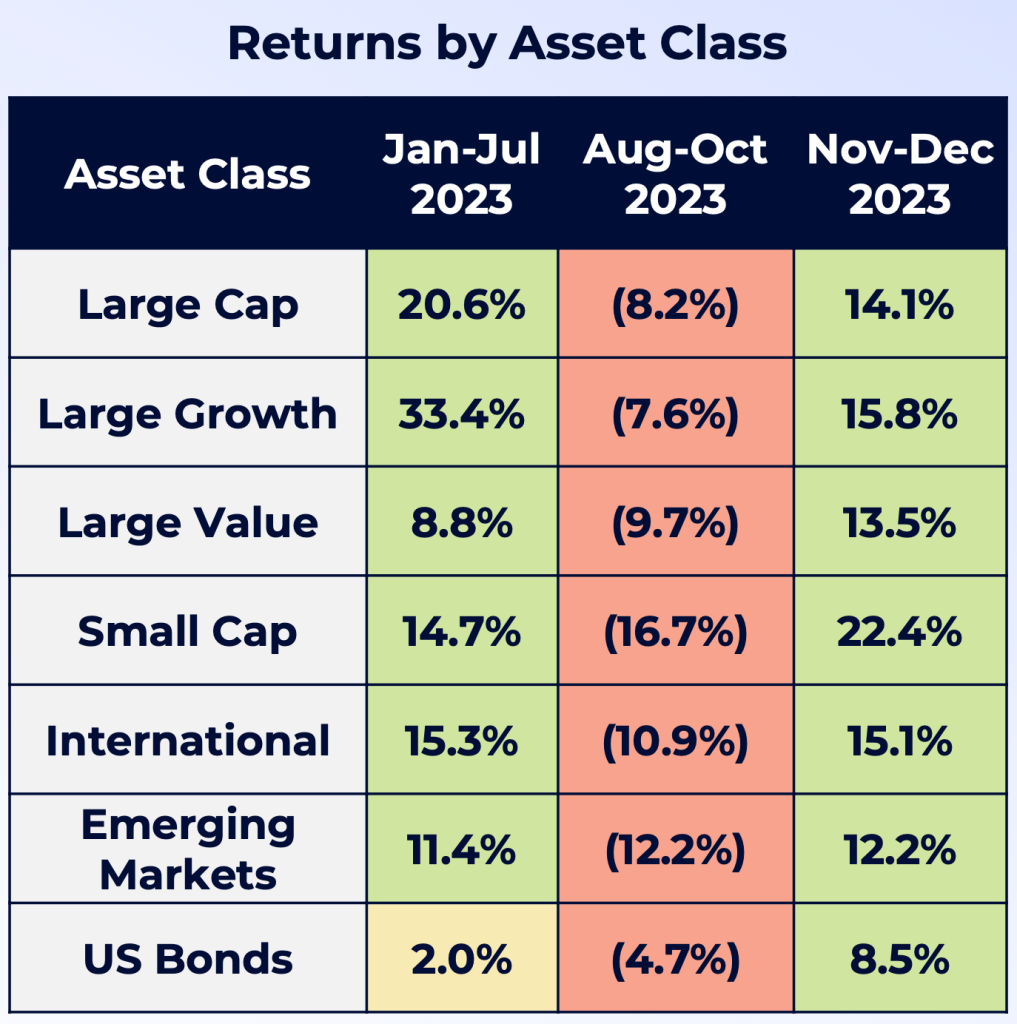
  • Lower valuations and buzz around Artificial Intelligence
  • A flight to safety in Big Tech due to the Banking Crisis

August – October: Bad news hit the markets, including:

  • Fitch Downgrade of US Debt Rating
  • Property Crisis in China
  • Surging Treasury Yields, US Dollar and Oil Prices

November – December: Markets Rallied into Year-End due to:

  • Declining Treasury Yields, Inflation, Oil Prices
  • “Powell Pivot” and belief the Fed tightening cycle is over
Source: Morningstar Direct & Bloomberg as of 12/31/2023, Large Cap: S&P 500, Large Growth: Russell 1000 Growth, Large Value: Russell 1000 Value, Small Cap: Russell 2000, International: MSCI EAFE, Emerging Markets: MSCI EM, US Bonds: Bloomberg US Agg


Key Indicators Signaling a “Soft Landing”

The market is pricing in a “soft landing” for the economy, in part due to:
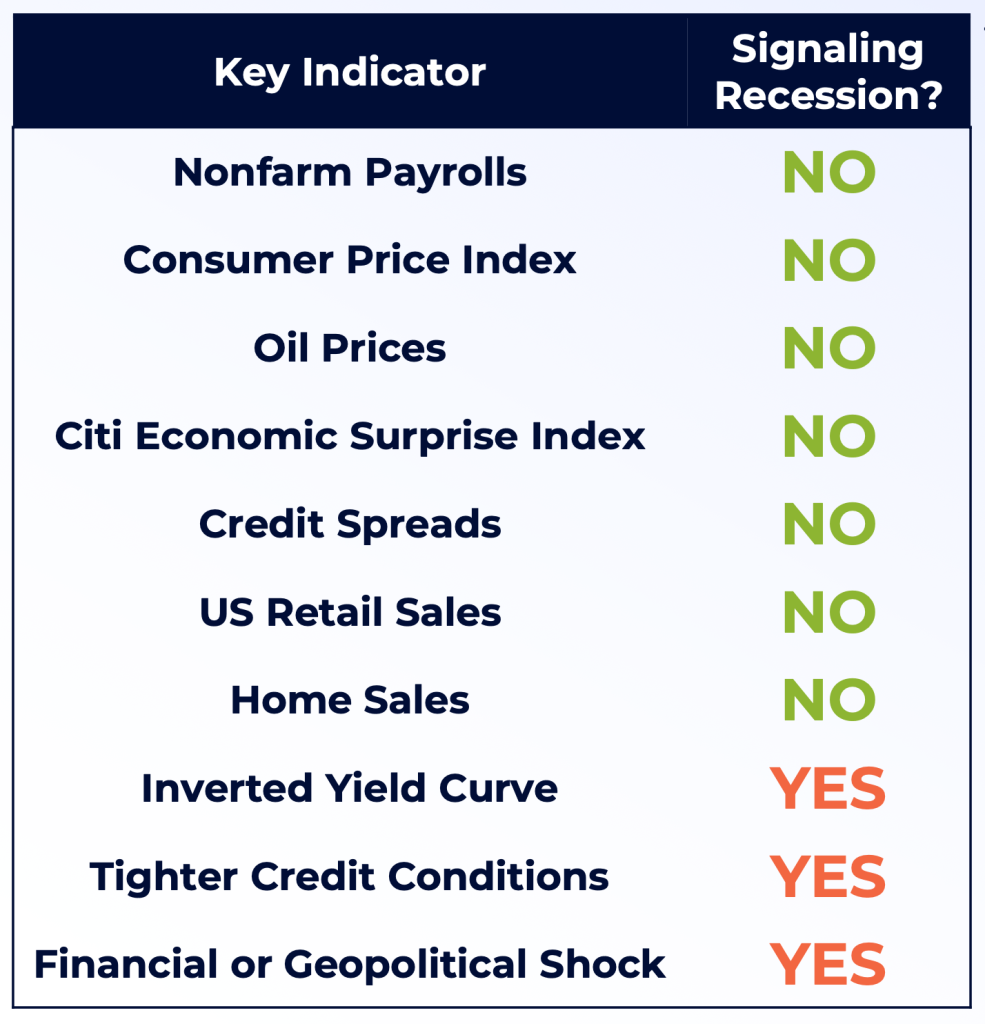
  • Strong Labor Market
  • Falling Inflation & Oil Prices
  • Narrow Credit Spreads
  • Resilient Consumer & Housing Market
  • Recession risks include:
  • Households Running Out of Excess Savings
  • Student Loan Repayments Restarting
  • Stickier Inflation
  • Rising Consumer Delinquency Rates
  • Slowing Bank Lending
  • Slowing Job Growth


Source: Bloomberg and Dynasty Financial Partners As of 12/31/2023


Inverted Yield Curve Continues to Signal a Recession

Every US Recession since the 1950s has been preceded by an inverted yield curve. The 10-year and 3-month yield curve is closely watched by investors and first inverted 419 days ago. History shows a Recession begins much later after a yield curve initially inverts. In fact, the average number of total days from the first date of inversion to the start of a Recession has been 589 days (dating back to the late-1960s). This leaves the current inversion period well below the historical average of when a Recession would begin.
An important reminder is the current yield curve has remained inverted for 284 consecutive trading days – its longest inversion on record.

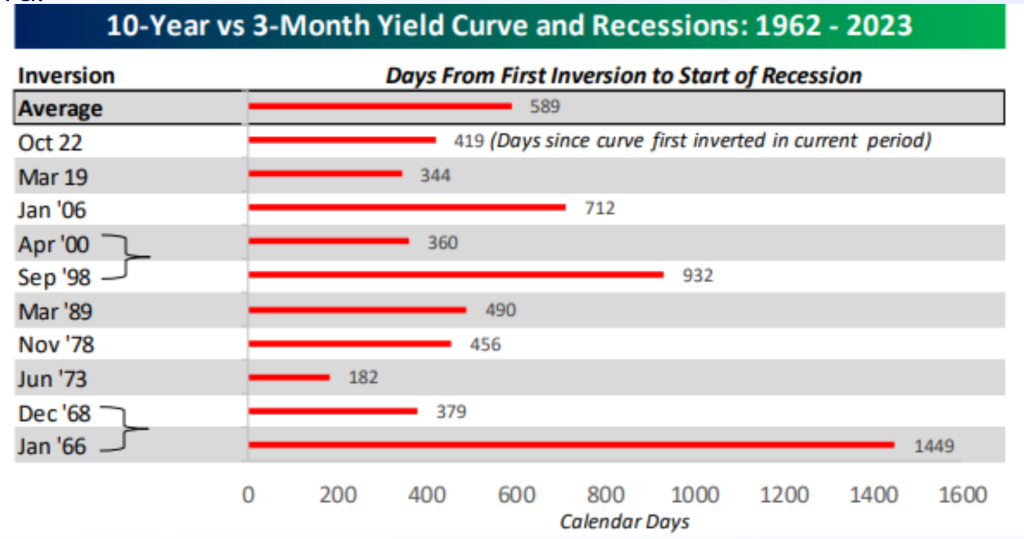
As of 12/20/2023, Source: Bespoke Investment Group, Inversions followed by same Recession, Data highlights first inversion with no other inversions in prior twelve months.


The “Powell Pivot”: Major Change in Fed Language

Monetary policy historically operates with a lagged effect on the economy. This makes it much trickier for Fed officials to determine when to stop raising rates, but it’s clear from the Fed’s most recent meeting that officials are now focusing on rate cuts in 2024. To highlight the “Powell pivot”, we compare key quotes below from Fed Chair Powell’s press conferences in November & December.
Notable Quotes from Fed Chair Powell’s Press Conference:

November 2023

  • “We’re not confident yet that we have achieved such a sufficiently restrictive stance”
  • “Inflation has been coming down, but it’s still running well above our 2 percent target”
  • “The fact is the Committee is not thinking about rate cuts right now at all. We’re not talking about rate cuts.”

December 2023

  • “We believe that our policy rate is likely at or near its peak for this tightening cycle…”
  • “Want to be reducing restriction on the economy well before 2 percent…so you don’t overshoot…”
  • “Question of when it will become appropriate to begin dialing back the amount of policy restraint in place, that begins to come into view…and a discussion for us at our meeting today”
    Source: US Federal Reserve As of 12/31/2023

The “Powell Pivot”: Rate Cuts Expected in 2024

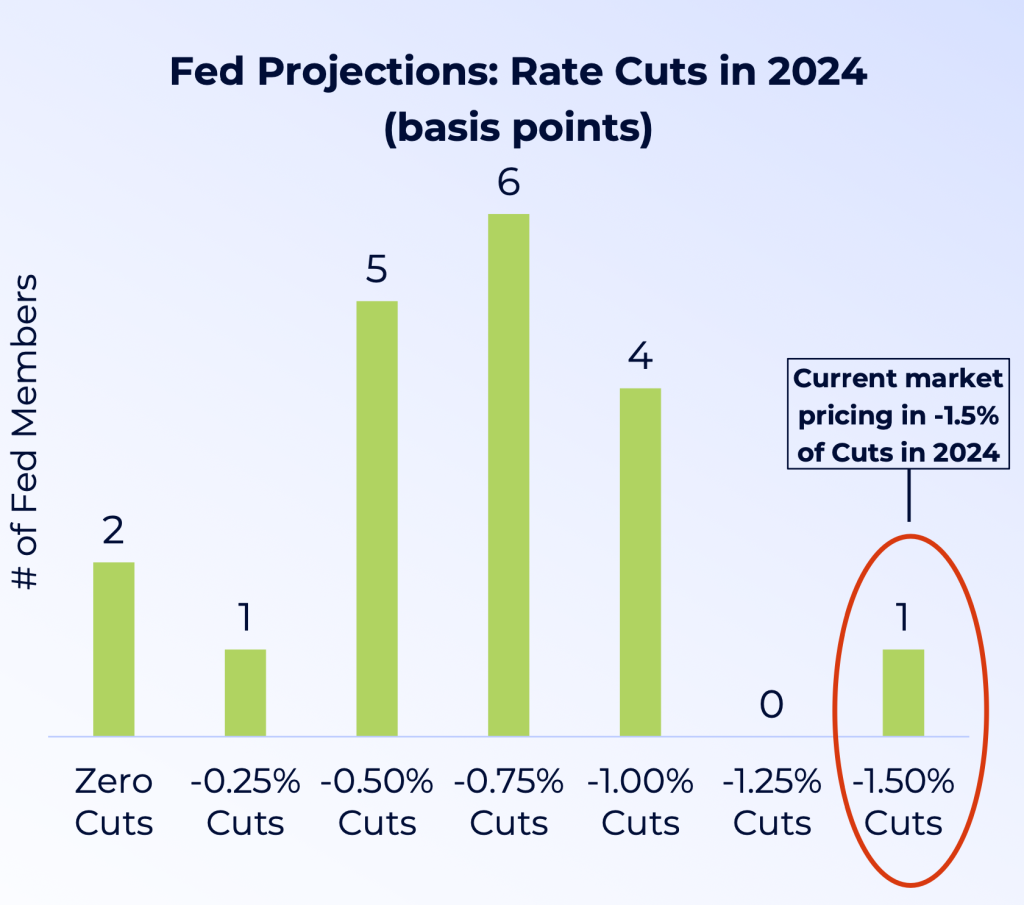
The “Powell Pivot” was also on full display when the Fed released their quarterly “Dot Plot” at the December meeting. The “Dot Plot” summarizes where FOMC members expect the Fed Funds Rate to finish in future years.

As shown to the right, a majority (6) of FOMC members expect 75 basis points of cuts in 2024. However, the market is currently pricing in 150 basis points of cuts in 2024. Once again, market expectations differ from the Fed.

The markets are also pricing in a 78% chance the first rate cut will occur at the March 20th meeting. Given the runup in equity prices and loosening financial conditions, we believe the Fed will do its best to hold off cutting rates until the second quarter.


Source: US Federal Reserve & CME FedWatch Tool As of 12/31/2023


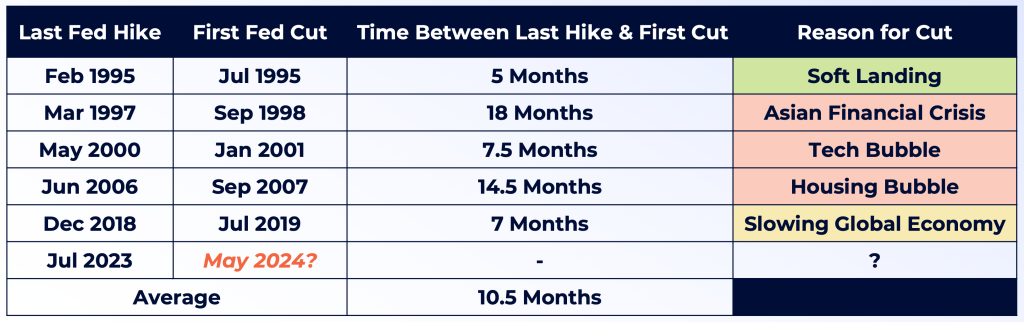
Historically How Long Until the Fed Cuts?

As the market turns its attention to rate cuts, the next question is when will the Fed begin cutting interest rates? In looking back over the past 30 years, the Fed has averaged roughly 10 months between the last hike and first cut. Given the last rate hike in this cycle occurred in July 2023, this would put the Fed on pace to beginning cutting in May 2024. It’s important to note the Fed historically has cut as early as 5 months after the last hike, and as late as 18 months (dating back to 1995).

Source: US Federal Reserve & Bloomberg, As of 12/31/2023, Projection for May 2024 Rate Cut is based on historical average between last Fed hike & first cut

History Points to the Bull Market Continuing

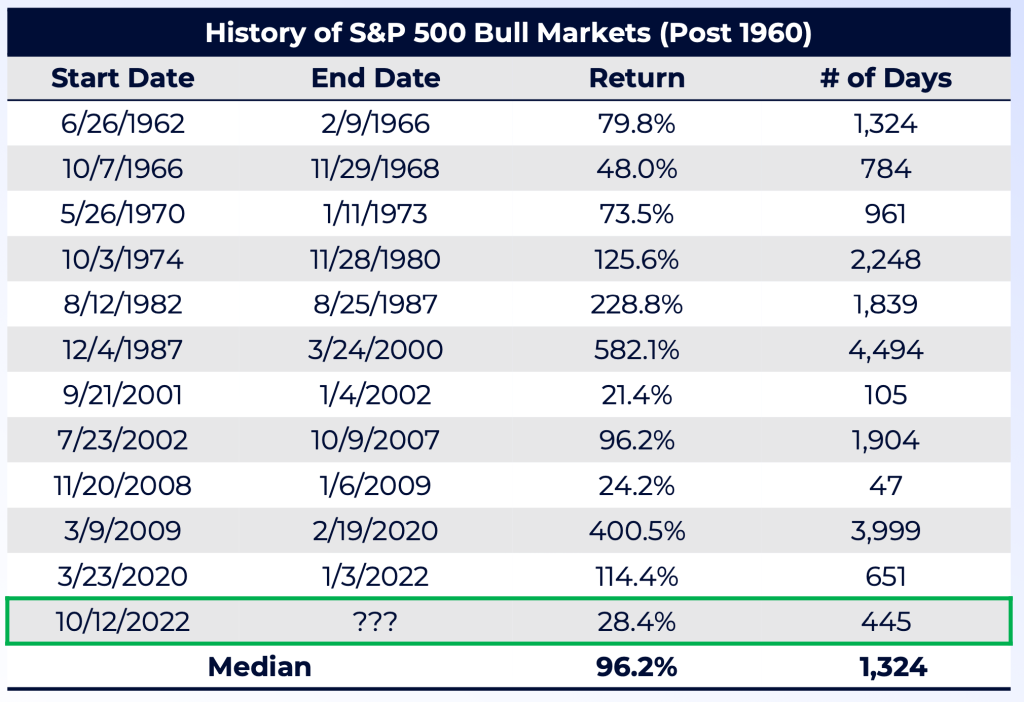
Despite volatility in 2023, US Stocks remain in a bull market that technically started on October 12th, 2022.

As shown on the right, Bull Markets can last many years and typically are much longer than Bear Markets. Excluding the current Bull Market, the US has seen 11 different Bull Markets dating back to the early 1960s – with a median return of 96%. The current Bull market has only returned 28%.

If the current Bull Market were to end, it would be one of the weakest and shortest bull markets. Since the early 1960s there there have only been two shorter bull markets (2001-2002 and 2008-2009).

Source: Bespoke Investment Group As of 12/31/2023


Investment Implications

1. Expect Volatility to Return Early in 2024:
Volatility was historically low in 2023 despite major geopolitical events and a hawkish Fed. In 2023 there were only two trading days where the S&P 500 saw +/- 2% moves compared to 46 trading days in 2022. We expect volatility to return early in 2024.


2. Presidential Election Years Historically Strong for Equities:
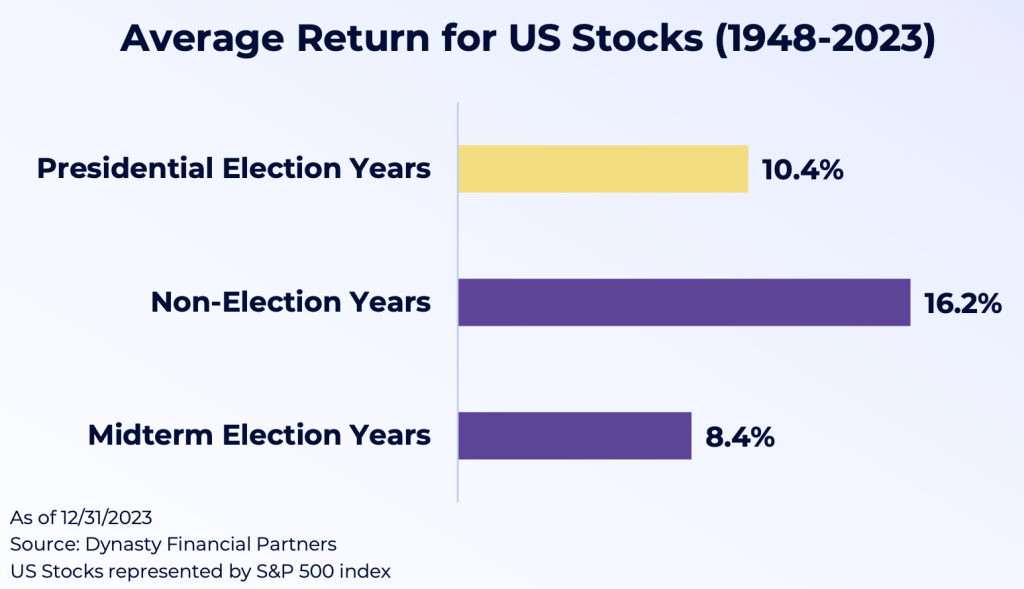
The strongest equity returns during a 4-year Presidential cycle have historically occurred during Non-Election Years, averaging 16.2% dating back to 1948. We witnessed this in 2023 with the S&P 500 rallying roughly 26%. Looking to 2024, Presidential Election years have averaged returns of 10.4%.
In next year’s Presidential Election, we expect a rematch of 2020. President Trump may all but lock up the Republican Nomination by “Super Tuesday” (March 5th) if he performs strongly in the first four primaries (Iowa, New Hampshire, Nevada, and South Carolina). We also expect President Biden to re-run barring any health concerns.


3. Small Caps Have Attractive Valuations:
The outperformance in Big Tech and Large Caps in 2023 has led to higher valuations. The Magnificent 7 have forward P/E ratios between 18x and 62x earnings. If we strip out these seven names, the remaining stocks in the S&P 500 have a median forward P/E of 17.4x. Despite the rally in Small Caps to end the year, the S&P 600 trades at just 15.0x. If the Fed can navigate a “soft landing,” we could see Smalls Caps continue to outperform.


4. Upside Risk to Yields:
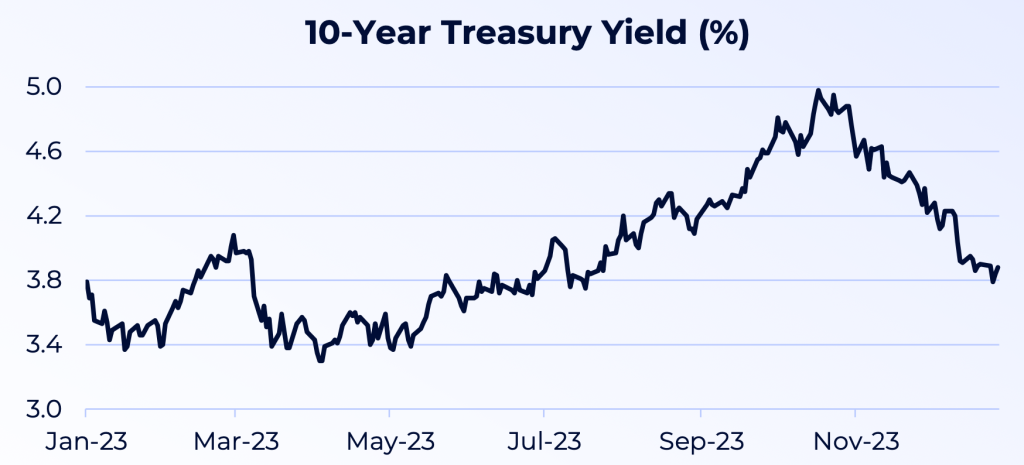
The bond market panicked into year-end and priced in a Recession and six rate cuts in 2024. We believe the chances of both happening are low. We especially feel a 10-year yield below 4% is too low compared to inflation expectations and real interest rates. Upside risks to yields also include large budget deficits and increasing treasury issuance.


5. Core Bonds Outperform During a Fed Pause:
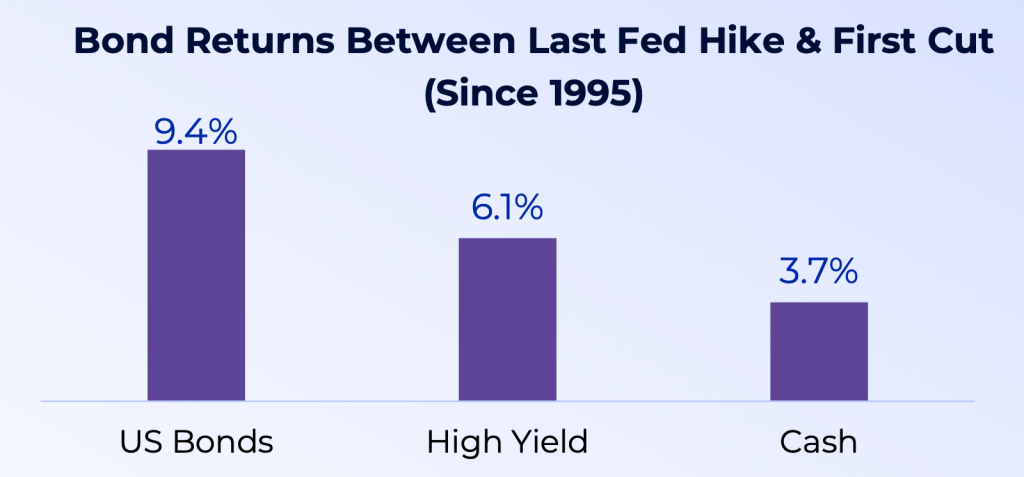
A Fed “pause” is historically a positive environment for fixed income, with Core Bonds (as measured by the Bloomberg US Agg Bond) outperforming High Yield and Cash. In fact, core bonds were positive during every “Fed Pause,” including the Dot-Com Bubble (dating back to 1995). Given the surge of assets in Money Market Funds, it’s important to note Cash underperformed in every “Fed pause” dating back to 1995.


6. US Large Caps Outperform During a Fed Pause:
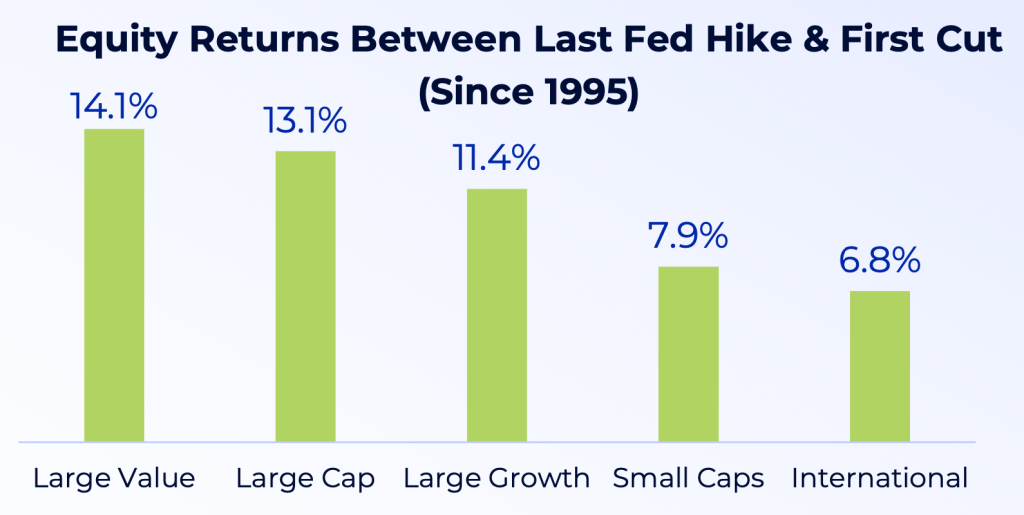
A Fed Pause is also historically a positive environment for equities, with Large Caps outperforming Small Caps and International equities. Large Value was the best performer and was positive during every “Fed Pause,” including the Dot-Com Bubble (dating back to 1995).


Centerline Wealth Advisors


This newsletter is limited to the dissemination of general information pertaining to the firm’s investment advisory services. This document is provided for informational purposes only and represents only a summary of the topics discussed. The contents should not be construed as personalized investment advice or recommendations. Rather, they simply reflect the opinions and views of the author(s) at the time of publication. This newsletter contains general information that is not suitable for everyone. Past performance is no guarantee of future results. There is no guarantee that the views and opinions expressed in this newsletter will come to pass. Investing in the stock market involves gains and losses, including loss of principal, and may not be suitable for all investors. There can be no assurance that any particular strategy or investment will prove profitable. This document contains information derived from third party sources. Although we believe these third party sources to be reliable, we make no representations as to the accuracy or completeness of any information derived from such sources, and take no responsibility therefore. Information presented herein is subject to change without notice and should not be considered as a solicitation to buy or sell any security. Certain statements contained herein are forward looking statements which point to future possibilities. Due to known and unknown risks, other uncertainties and other factors, actual results may differ materially from the results portrayed in such forward-looking statements. Please remember that Centerline Wealth Advisors does not provide legal or tax advice, you should speak to your legal and tax advisors about your specific circumstances. Centerline Wealth Advisors, LLC (“Centerline Wealth Advisors” or the “firm”) is an SEC registered investment adviser with its principal place of business located in Kentucky. Registration does not imply a certain level of skill or training. Centerline Wealth Advisors may only transact business in those states in which it is notice filed, or qualifies for an exemption or exclusion from notice filing requirements. For information pertaining to the registration status of the firm, please contact the SEC on their web site at www.adviserinfo.sec.gov. For a copy of the Centerline Wealth Advisors Privacy Policy, Terms of Use, Disclosure and ADV Document, click the links below.
Copyright © 2024 Centerline Wealth Advisors, All rights reserved.

Just Add Capital

By | Exit Planning | No Comments

Just Add Capital

If you’re looking to attract an investor or an acquirer one day, expect them to dig into your sales and marketing process.

If you’re a company that sells to other businesses, an investor will want to know where you get your leads from and how much each costs you to generate. They’ll want to know what technology you are utilizing to support your sales team. They’ll want to understand how your sales reps get meetings and how many appointments a good rep has each week. They’ll want to know the close rate of a high performer and how it compares to an average performer.

The investor’s questions aim to gauge the scalability of your sales model under significantly higher investment rather than simply to assess your past performance. Acquirers love stumbling over a business where the main constraint to growth is capital. They fall over themselves for a company that has an efficient sales engine that needs more fuel (i.e., money). Most investors have lots of capital but struggle to find businesses with a sales system that won’t collapse under the weight of more money.

How Gregg Romanzo Built a Sales System

In 2004 Gregg Romanzo started an old-school freight brokering business. Most freight brokers are nothing more than a handful of people arranging shipments in return for razor-thin margins, but Romanzo realized his sales model had the potential to grow into something much bigger.

Romanzo’s model involved hiring high-potential people with a relatively modest base salary of between $40,000 and $60,000 per year and teaching them the business from scratch. He armed them with a computer and access to the best scheduling software and tied their variable compensation to the gross margin of the jobs they booked. Romanzo knew if he could get a rep to clear $100,000 per year in total compensation, he would be able to keep them for the long run.

Romanzo took his very best talent—the top one or two percent—and built a team around them so they could earn even more. This cohort of salespeople could clear three, four, or even five hundred thousand dollars in an exceptional year.

Since Romanzo paid a relatively low base salary and his people didn’t need a lot of equipment, he was able to hire a lot of salespeople. By the time he sold his company, he had 200 employees, 190 of which were salespeople. That’s 95% of his headcount dedicated to sales.

How does that compare to your company? If you have a winning formula you think would hold up if you doubled or quadrupled your sales team, consider monetizing the sales model you’ve created. Either hire a lot more reps or show a deep-pocketed investor or acquirer how durable your sales model is and how all you need is their capital to grow it.

To learn more about our program and see how we can help you prepare for the sale of your business go to www.Biz2Beach.com

The Switzerland Structure

By | Exit Planning | No Comments

The Switzerland Structure

One of the eight factors that impact the value of your company is something the team at The Value Builder SystemÔ refers to as “The Switzerland Structure,” which emphasizes the importance of business independence. It cautions against excessive reliance on any single entity, whether suppliers, employees, or customers. While many business owners recognize the risks associated with dependency on a high-profile customer or employee, the hazards of anchoring to a single supplier are often overlooked.

Supplier dependency comes in many flavors, but the most pernicious is a dependency on a single marketing supplier for sales leads, such as a dominant e-commerce site or social media platform.

6 Ways Marketing Supplier Dependency Cuts Your Value

Amazon, for instance, is a prime example where businesses heavily invest to gain market access and visibility. However, dependence on a single sales platform like Amazon can devalue a business in the eyes of investors or acquirers for several reasons:

  1. Increased Risk Exposure: Sole reliance on one platform exposes a business to risks of sudden policy, fee, or algorithm changes. Such negative alterations by the platform could significantly impact the business’s sales and profitability.
  2. Lack of Diversification: Over-dependence on a single channel is perceived as a vulnerability, while a diversified sales approach suggests resilience and adaptability, appealing attributes to both investors and acquirers.
  3. Limited Growth Potential: Exclusive reliance on one platform can restrict a company’s growth opportunities. Investors typically favor businesses with multiple channels for growth. Being bound to one platform can limit a business’s potential for expansion.
  4. Brand and Customer Relationship Limitations: Operating primarily through a third-party platform may lead to limited customer interaction, hindering the development of a strong brand identity and customer loyalty, both highly valued by investors.
  5. Negotiating Power and Autonomy: Dependence on a platform like Amazon can reduce control over crucial business aspects, such as pricing and customer service. Investors may view this lack of autonomy as a strategic weakness.
  6. Perception of Innovation and Independence: Businesses demonstrating innovation and independence are often more attractive to investors. Over-reliance on a single platform can create an impression of a lack of these qualities.

How Chad Maghielse Improved His Score on the Switzerland Structure

Chad Maghielse’s company, Pets Are Kids Too, originated with a simple spray to help improve his dog’s breath and swiftly expanded to over $2 million in sales with a 35% profit margin within three years, relying solely on Amazon. Recognizing the risks of this dependence on the e-commerce giant, Maghielse embarked on a path of supplier diversification.

Maghielse expanded to another e-commerce platform, Chewy.com, and launched his own online store. This strategy reduced Amazon’s share of his sales to 65%, while Chewy and his store contributed 30% and 5%, respectively. A significant reduction in his business’s platform risk and an increase in its appeal to potential buyers resulted from this strategic shift.

Thanks in part to Maghielse’s diversification strategy, Pets Are Kids Too was acquired in a deal that valued the company at three times its EBITDA, with a substantial portion paid up front. Maghielse’s journey highlights the critical insight that diversification not only shields against market volatility but also enhances a business’s overall value.

Embracing the Mentality of the Swiss

Reducing your reliance on a single marketing supplier not only bolsters your company’s market resilience but also notably increases its value. Adopting a Swiss-style mindset, which values independence and strategic autonomy, is more than a tactical move; it is a key strategy for achieving sustainable growth and boosting the value of your business in the long run.


To learn more about our program and see how we can help you prepare for the sale of your business go to www.Biz2Beach.com

Core Values as a Growth Catalyst: The $14 Million Journey of Sauceda Industries   

By | Exit Planning | No Comments

In the competitive third-party logistics (3PL) sector, Jay B Sauceda turned Sauceda Industries into a standout business, ultimately reaching $14 million in sales before being acquired by Cart.com.

His secret weapon? His core values: “Yes, And,” “Explore More,” and “Give a Sh!t.”

Talent Recruitment

Sauceda found his first significant opportunity with Howler Brothers, the digitally native purveyor or stylish and rugged outdoor gear whose leadership related to Sauceda’s core values.

Sauceda’s values weren’t mere posters on a wall but embedded into job descriptions, ensuring new hires were aligned with the company ethos. “Yes, And” fostered constructive dialogue, “Explore More” encouraged initiative, and “Give a Sh!t” signaled a commitment to quality.

In the fiercely competitive landscape for hourly workers, Sauceda utilized job ads as both a magnet and a filter. His distinctive ads read:

“We’re looking for someone who gives a shit about their work, gets annoyed with coworkers who don’t pull their weight, wants to level themselves up in a big way and cares about being somewhere long enough that people remember their name.” 

Such postings instantly distinguished Sauceda Industries from the mundane listings of competitors, drawing talent aligned with the company’s dynamic culture.

Employee Training and Metrics

New hires were introduced to Sauceda’s values through dedicated training programs. Performance evaluations considered not just revenue metrics but also the embodiment of Sauceda’s core principles. Employees who exemplified “Yes, And,” “Explore More,” and “Give a Sh!t” found themselves rewarded and recognized. Their Slack channel was full of praise for team members embodying their core values.

Creating a distinctive culture was crucial for Sauceda. He recalls, “Our values lived in our daily interactions, whether it was an employee going above and beyond for a client or in our collaborations.”

Client Relationships

The core values extended to client interactions, offering criteria for long-term partnerships. A cornerstone example was Howler Brothers, whose alignment with these values set the stage for both parties’ success. Sauceda emphasized, “When a client fits naturally with our core values, the collaboration is far more likely to be fruitful.”

A Valuable Company

Leveraging this values-centric model, Sauceda Industries grew from a 3,000-square-foot office in 2013 to a sprawling 126,000-square-foot facility with 150 employees by 2020. “We bootstrapped all the way to the top,” Sauceda asserted, attributing the company’s fast, self-funded growth to its value-driven framework.

In the competitive 3PL landscape, Sauceda Industries didn’t just serve clients; it built relationships based on shared values. Through strategic recruitment, impactful training, and a vibrant work culture, these core values helped pave the way for a business that thrived, achieving $14 million in sales before it was acquired by Cart.com in 2021.


To learn more about our program and see how we can help you prepare for the sale of your business go to www.Biz2Beach.com