2023 Winners & Losers:
 Source: Morningstar Direct, Bloomberg, Bespoke Investment Group and Dynasty Financial Partners As of 12/31/2023
S&P 500 Approaching All-Time Highs
– Four themes dominated 2023:
- Artificial Intelligence
- “Magnificent 7”
- Federal Reserve
- Inflation
– The S&P 500 ended the year on a nine-week winning streak, its longest since 2004.
– US Small Caps and Bonds were both negative YTD though October, but significantly rallied into year-end on the hopes of a 0% “soft landing” and rate cuts.
A Tale of Three Markets in 2023
January – July: Markets rallied to start 2023, in part due to: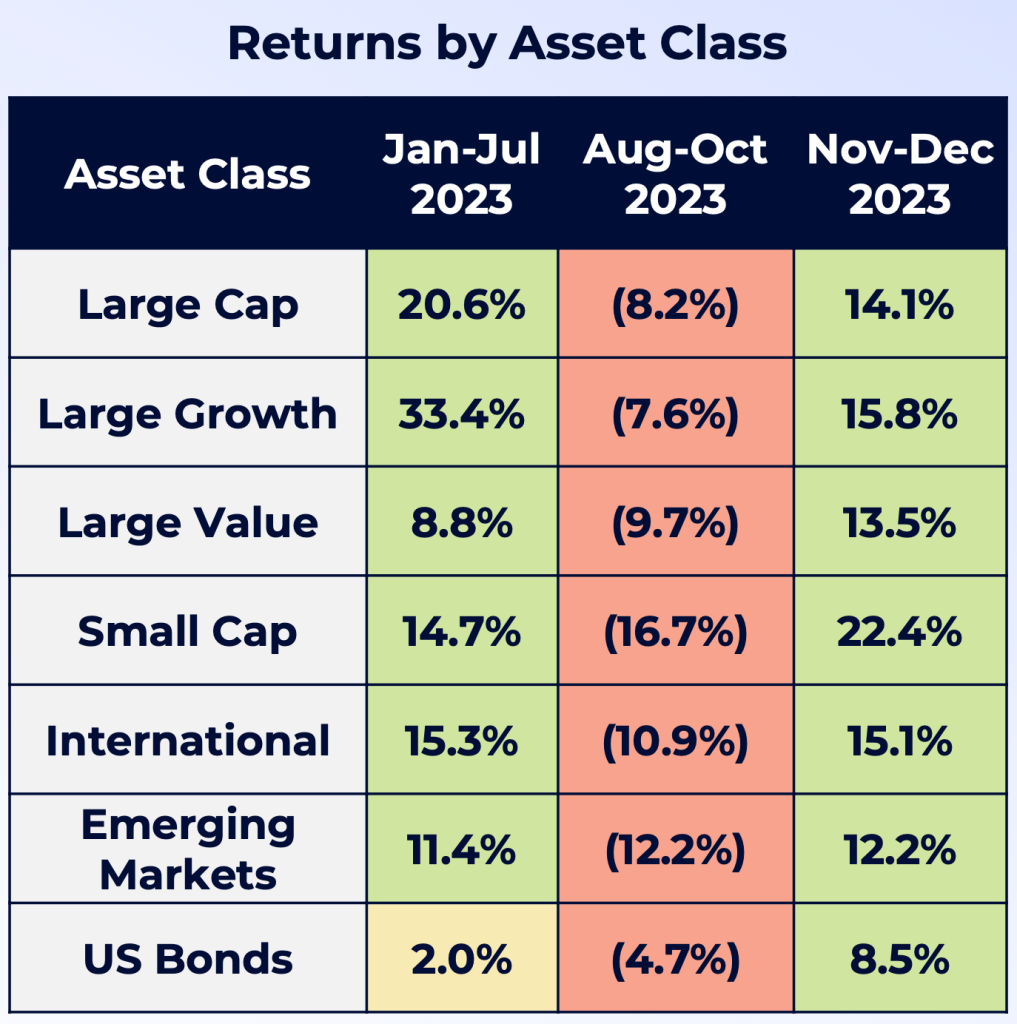
- Lower valuations and buzz around Artificial Intelligence
- A flight to safety in Big Tech due to the Banking Crisis
August – October: Bad news hit the markets, including:
- Fitch Downgrade of US Debt Rating
- Property Crisis in China
- Surging Treasury Yields, US Dollar and Oil Prices
November – December: Markets Rallied into Year-End due to:
- Declining Treasury Yields, Inflation, Oil Prices
- “Powell Pivot” and belief the Fed tightening cycle is over
Source: Morningstar Direct & Bloomberg as of 12/31/2023, Large Cap: S&P 500, Large Growth: Russell 1000 Growth, Large Value: Russell 1000 Value, Small Cap: Russell 2000, International: MSCI EAFE, Emerging Markets: MSCI EM, US Bonds: Bloomberg US Agg
Key Indicators Signaling a “Soft Landing”
The market is pricing in a “soft landing” for the economy, in part due to: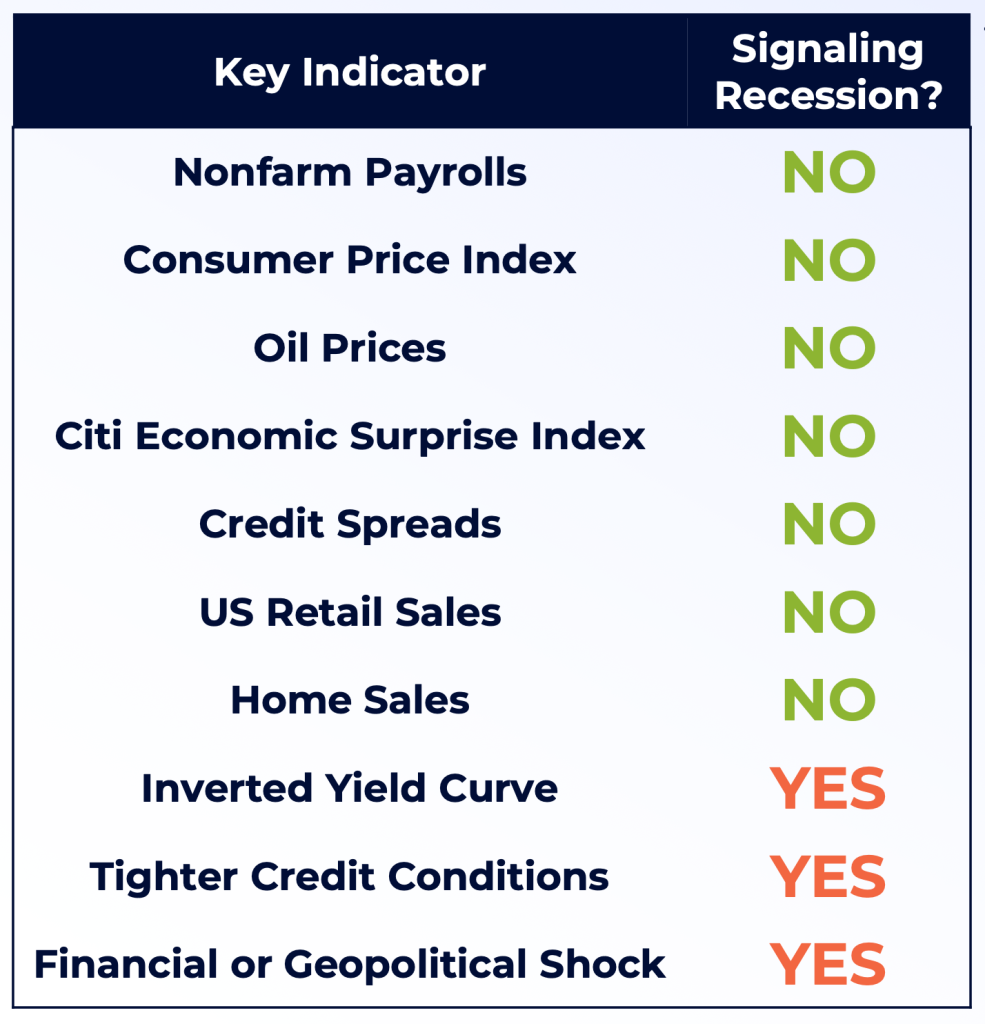
- Strong Labor Market
- Falling Inflation & Oil Prices
- Narrow Credit Spreads
- Resilient Consumer & Housing Market
- Recession risks include:
- Households Running Out of Excess Savings
- Student Loan Repayments Restarting
- Stickier Inflation
- Rising Consumer Delinquency Rates
- Slowing Bank Lending
- Slowing Job Growth
Source: Bloomberg and Dynasty Financial Partners As of 12/31/2023
Inverted Yield Curve Continues to Signal a Recession
Every US Recession since the 1950s has been preceded by an inverted yield curve. The 10-year and 3-month yield curve is closely watched by investors and first inverted 419 days ago. History shows a Recession begins much later after a yield curve initially inverts. In fact, the average number of total days from the first date of inversion to the start of a Recession has been 589 days (dating back to the late-1960s). This leaves the current inversion period well below the historical average of when a Recession would begin.
An important reminder is the current yield curve has remained inverted for 284 consecutive trading days – its longest inversion on record.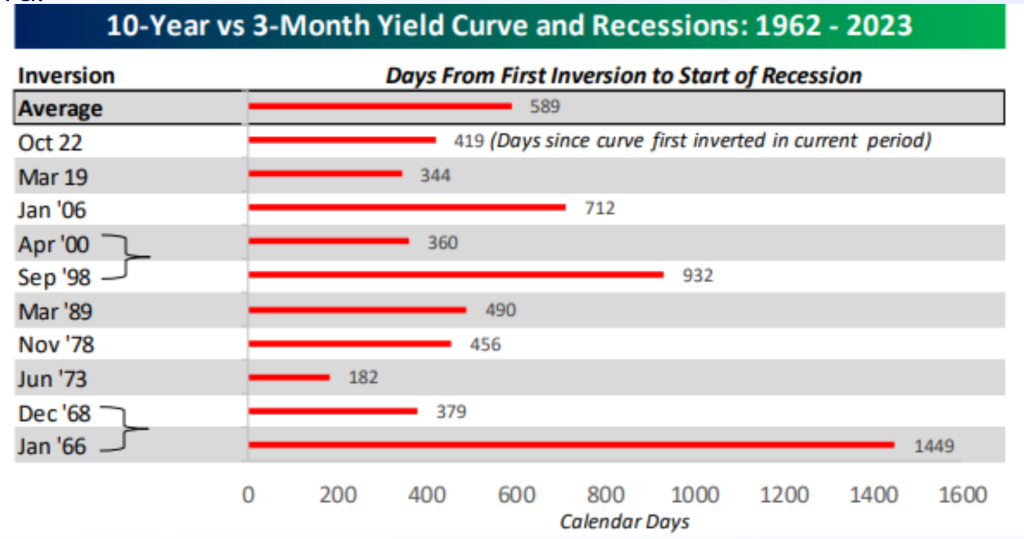
As of 12/20/2023, Source: Bespoke Investment Group, Inversions followed by same Recession, Data highlights first inversion with no other inversions in prior twelve months.
The “Powell Pivot”: Major Change in Fed Language
Monetary policy historically operates with a lagged effect on the economy. This makes it much trickier for Fed officials to determine when to stop raising rates, but it’s clear from the Fed’s most recent meeting that officials are now focusing on rate cuts in 2024. To highlight the “Powell pivot”, we compare key quotes below from Fed Chair Powell’s press conferences in November & December.
Notable Quotes from Fed Chair Powell’s Press Conference:
November 2023
- “We’re not confident yet that we have achieved such a sufficiently restrictive stance”
- “Inflation has been coming down, but it’s still running well above our 2 percent target”
- “The fact is the Committee is not thinking about rate cuts right now at all. We’re not talking about rate cuts.”
December 2023
- “We believe that our policy rate is likely at or near its peak for this tightening cycle…”
- “Want to be reducing restriction on the economy well before 2 percent…so you don’t overshoot…”
- “Question of when it will become appropriate to begin dialing back the amount of policy restraint in place, that begins to come into view…and a discussion for us at our meeting today”
Source: US Federal Reserve As of 12/31/2023
The “Powell Pivot”: Rate Cuts Expected in 2024
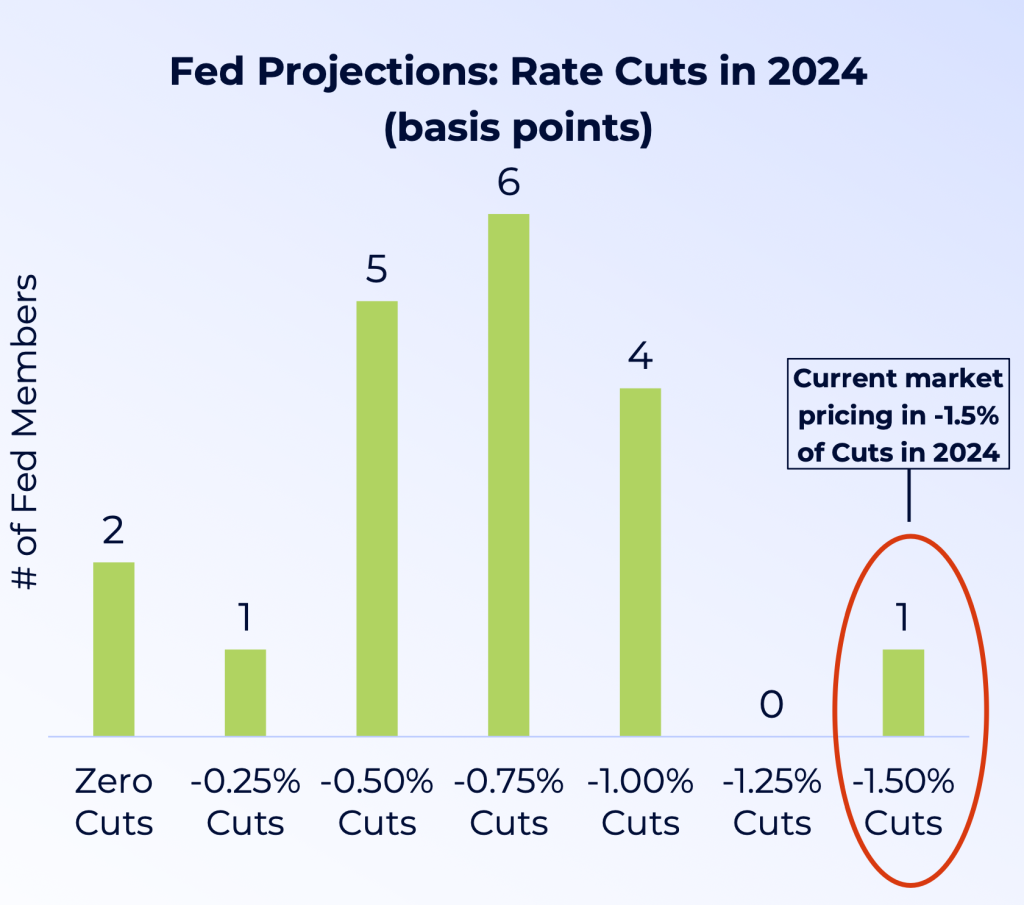 The “Powell Pivot” was also on full display when the Fed released their quarterly “Dot Plot” at the December meeting. The “Dot Plot” summarizes where FOMC members expect the Fed Funds Rate to finish in future years.
As shown to the right, a majority (6) of FOMC members expect 75 basis points of cuts in 2024. However, the market is currently pricing in 150 basis points of cuts in 2024. Once again, market expectations differ from the Fed.
The markets are also pricing in a 78% chance the first rate cut will occur at the March 20th meeting. Given the runup in equity prices and loosening financial conditions, we believe the Fed will do its best to hold off cutting rates until the second quarter.
Source: US Federal Reserve & CME FedWatch Tool As of 12/31/2023
Historically How Long Until the Fed Cuts?
As the market turns its attention to rate cuts, the next question is when will the Fed begin cutting interest rates? In looking back over the past 30 years, the Fed has averaged roughly 10 months between the last hike and first cut. Given the last rate hike in this cycle occurred in July 2023, this would put the Fed on pace to beginning cutting in May 2024. It’s important to note the Fed historically has cut as early as 5 months after the last hike, and as late as 18 months (dating back to 1995).
Source: US Federal Reserve & Bloomberg, As of 12/31/2023, Projection for May 2024 Rate Cut is based on historical average between last Fed hike & first cut
History Points to the Bull Market Continuing
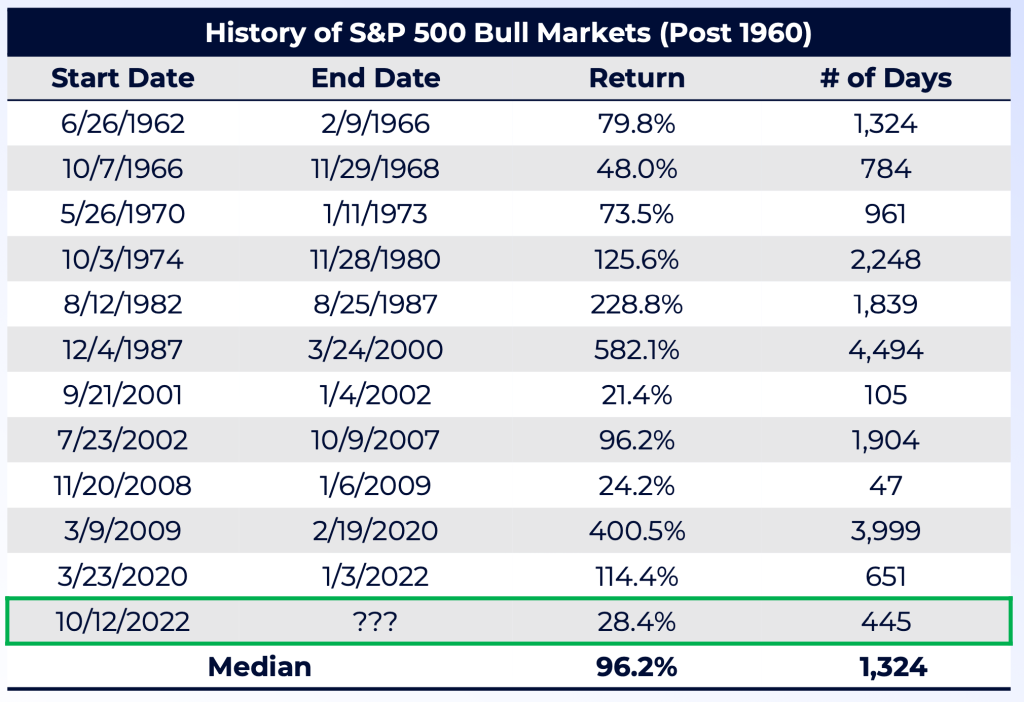
Despite volatility in 2023, US Stocks remain in a bull market that technically started on October 12th, 2022.
As shown on the right, Bull Markets can last many years and typically are much longer than Bear Markets. Excluding the current Bull Market, the US has seen 11 different Bull Markets dating back to the early 1960s – with a median return of 96%. The current Bull market has only returned 28%.
If the current Bull Market were to end, it would be one of the weakest and shortest bull markets. Since the early 1960s there there have only been two shorter bull markets (2001-2002 and 2008-2009).
Source: Bespoke Investment Group As of 12/31/2023
Investment Implications
1. Expect Volatility to Return Early in 2024:
Volatility was historically low in 2023 despite major geopolitical events and a hawkish Fed. In 2023 there were only two trading days where the S&P 500 saw +/- 2% moves compared to 46 trading days in 2022. We expect volatility to return early in 2024.
2. Presidential Election Years Historically Strong for Equities: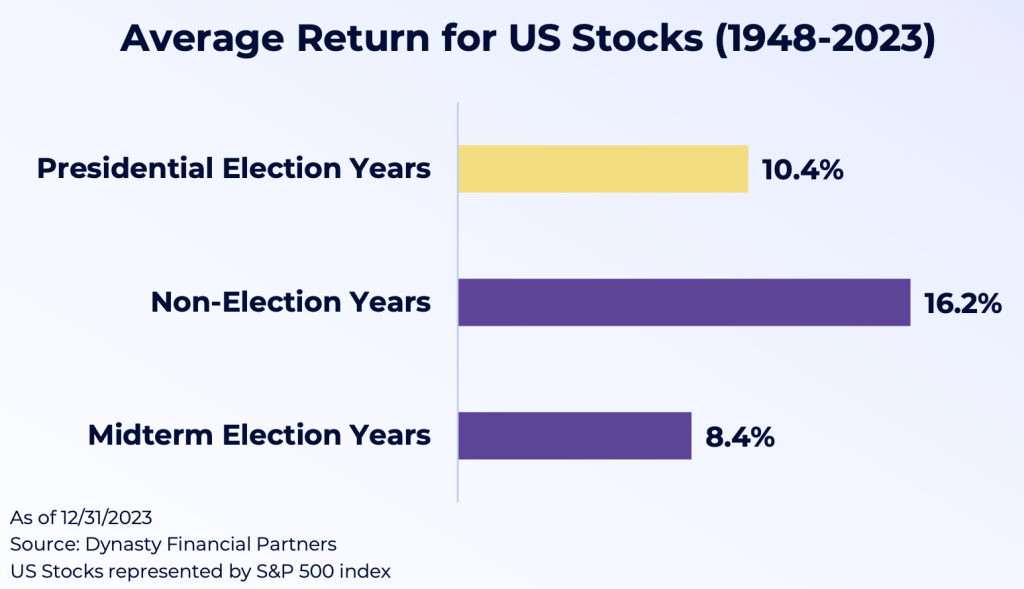
The strongest equity returns during a 4-year Presidential cycle have historically occurred during Non-Election Years, averaging 16.2% dating back to 1948. We witnessed this in 2023 with the S&P 500 rallying roughly 26%. Looking to 2024, Presidential Election years have averaged returns of 10.4%.
In next year’s Presidential Election, we expect a rematch of 2020. President Trump may all but lock up the Republican Nomination by “Super Tuesday” (March 5th) if he performs strongly in the first four primaries (Iowa, New Hampshire, Nevada, and South Carolina). We also expect President Biden to re-run barring any health concerns.
3. Small Caps Have Attractive Valuations:
The outperformance in Big Tech and Large Caps in 2023 has led to higher valuations. The Magnificent 7 have forward P/E ratios between 18x and 62x earnings. If we strip out these seven names, the remaining stocks in the S&P 500 have a median forward P/E of 17.4x. Despite the rally in Small Caps to end the year, the S&P 600 trades at just 15.0x. If the Fed can navigate a “soft landing,” we could see Smalls Caps continue to outperform.
4. Upside Risk to Yields: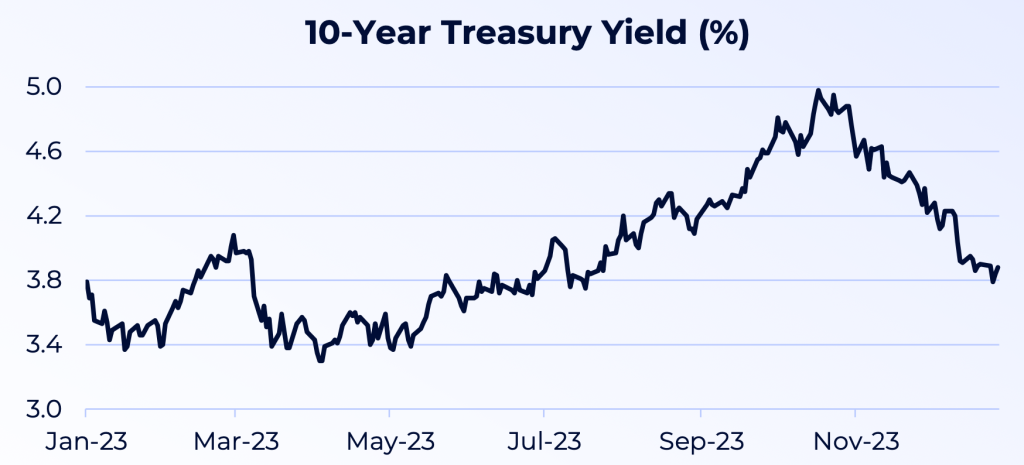
The bond market panicked into year-end and priced in a Recession and six rate cuts in 2024. We believe the chances of both happening are low. We especially feel a 10-year yield below 4% is too low compared to inflation expectations and real interest rates. Upside risks to yields also include large budget deficits and increasing treasury issuance.
5. Core Bonds Outperform During a Fed Pause: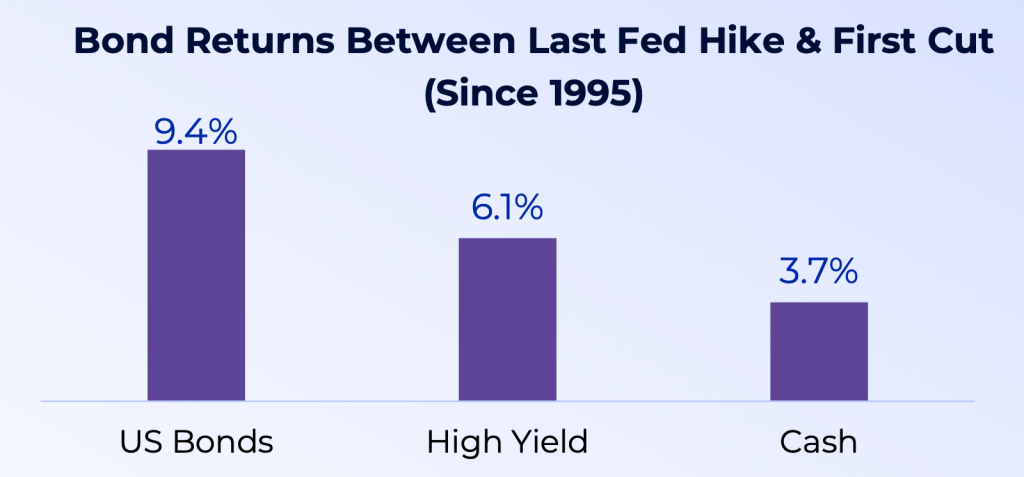
A Fed “pause” is historically a positive environment for fixed income, with Core Bonds (as measured by the Bloomberg US Agg Bond) outperforming High Yield and Cash. In fact, core bonds were positive during every “Fed Pause,” including the Dot-Com Bubble (dating back to 1995). Given the surge of assets in Money Market Funds, it’s important to note Cash underperformed in every “Fed pause” dating back to 1995.
6. US Large Caps Outperform During a Fed Pause: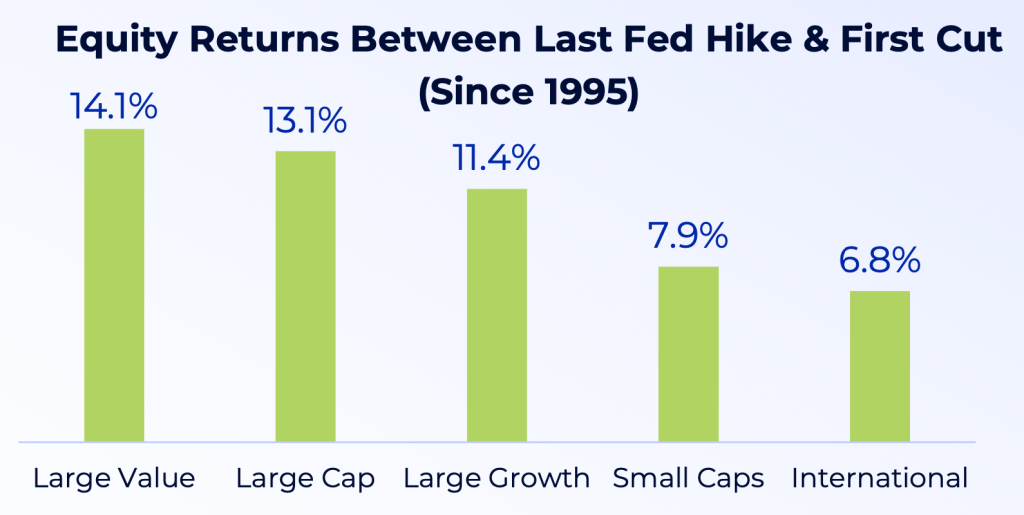
A Fed Pause is also historically a positive environment for equities, with Large Caps outperforming Small Caps and International equities. Large Value was the best performer and was positive during every “Fed Pause,” including the Dot-Com Bubble (dating back to 1995).


